normal_header
NEW: Embedded Payroll in CORE! Learn more.

See Insights in Action

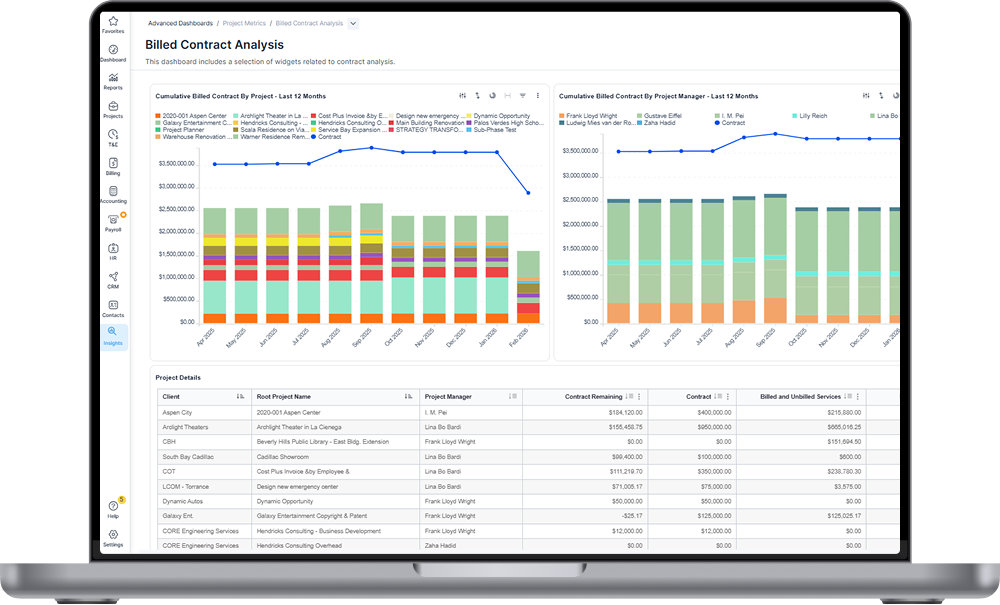
Get a short walkthrough of how Insights will help your team staff smarter, plan with real data, and protect margin before you commit to new work. Create and display the metrics that matter to your individual firm. Unleash your data to run a smarter, more efficient practice.

Insights Bar Chart - Billed Contract Analysis

From Data to Decision, Instantly.

  • Ready to use in the system you know.
    Dashboards ready on day one — no blank canvas, no wait. Already on Power BI? Same data, right inside CORE. No second system, no sync to break.

  • Any answer, in minutes.
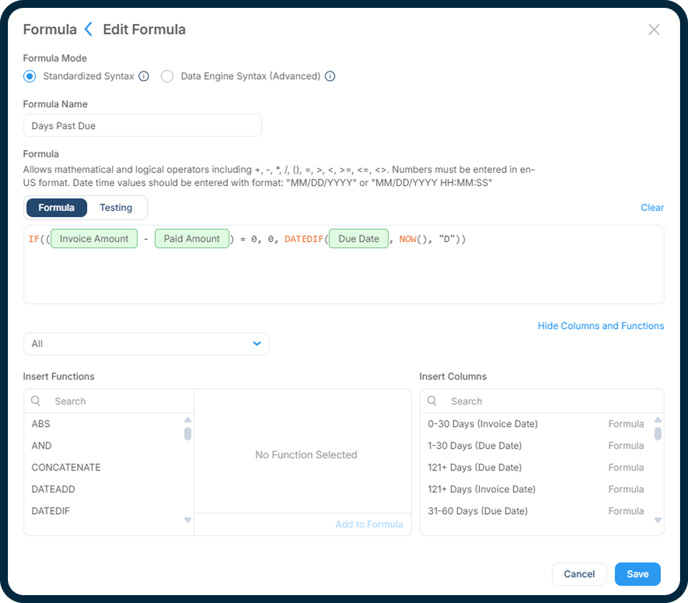
    A different question? Build the dashboard you need in the platform you already use. No coding, no specialist, no wait.
  • Dive deep into data.
    Every dashboard is a starting point. Click any margin, balance, or metric and trace it to the project, client, or PM behind it — no separate report, no second request.

  • Customize for your firm and your people.
    Create and display the metrics that matter to your people, and the unique way you run your business.
  • Slice it, shape it, send it anywhere.
    Combine what you need, send it anywhere — Excel, a client deck, wherever. No fixed format. No default view.

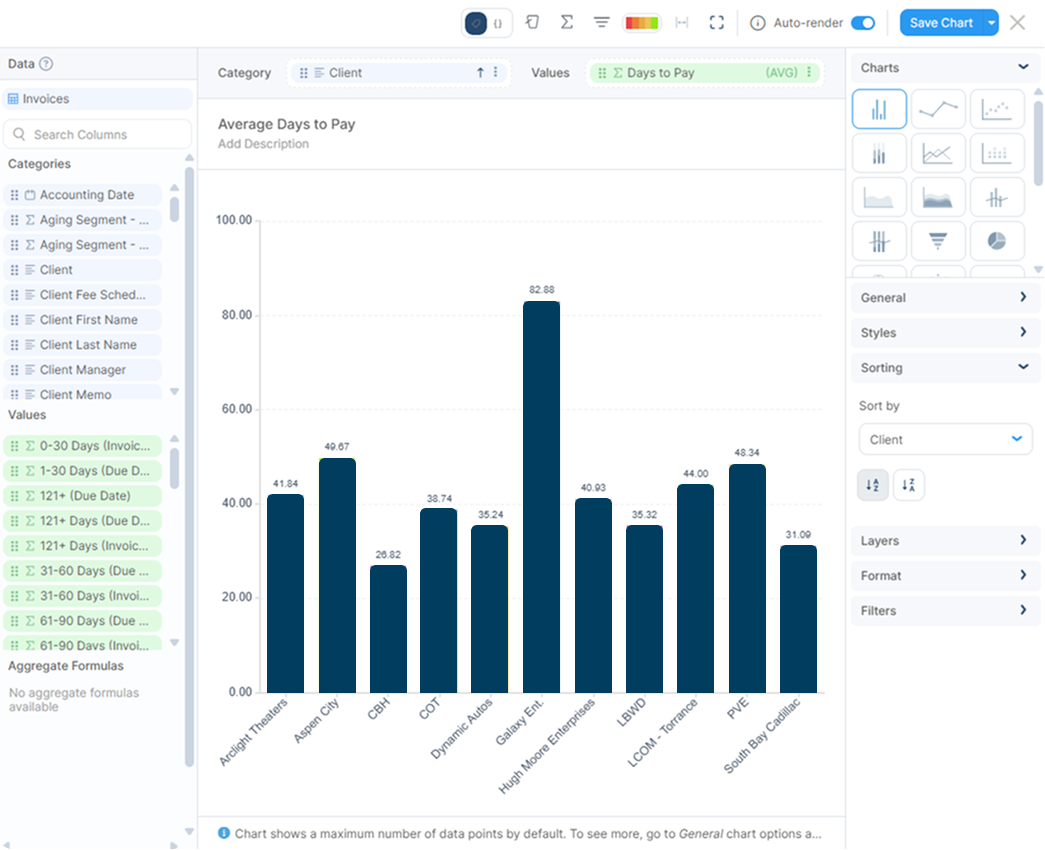
Insights Bar Chart

Questions you ask every week. Answered.

  • Where is cash flow getting stuck?
    Sort your Accounts Receivable by client, project type, PM, and more, and find the root of any problem.

  • Are we delivering projects profitably?
    Know which projects, clients, and PMs are driving your success, and which are weighing it down.

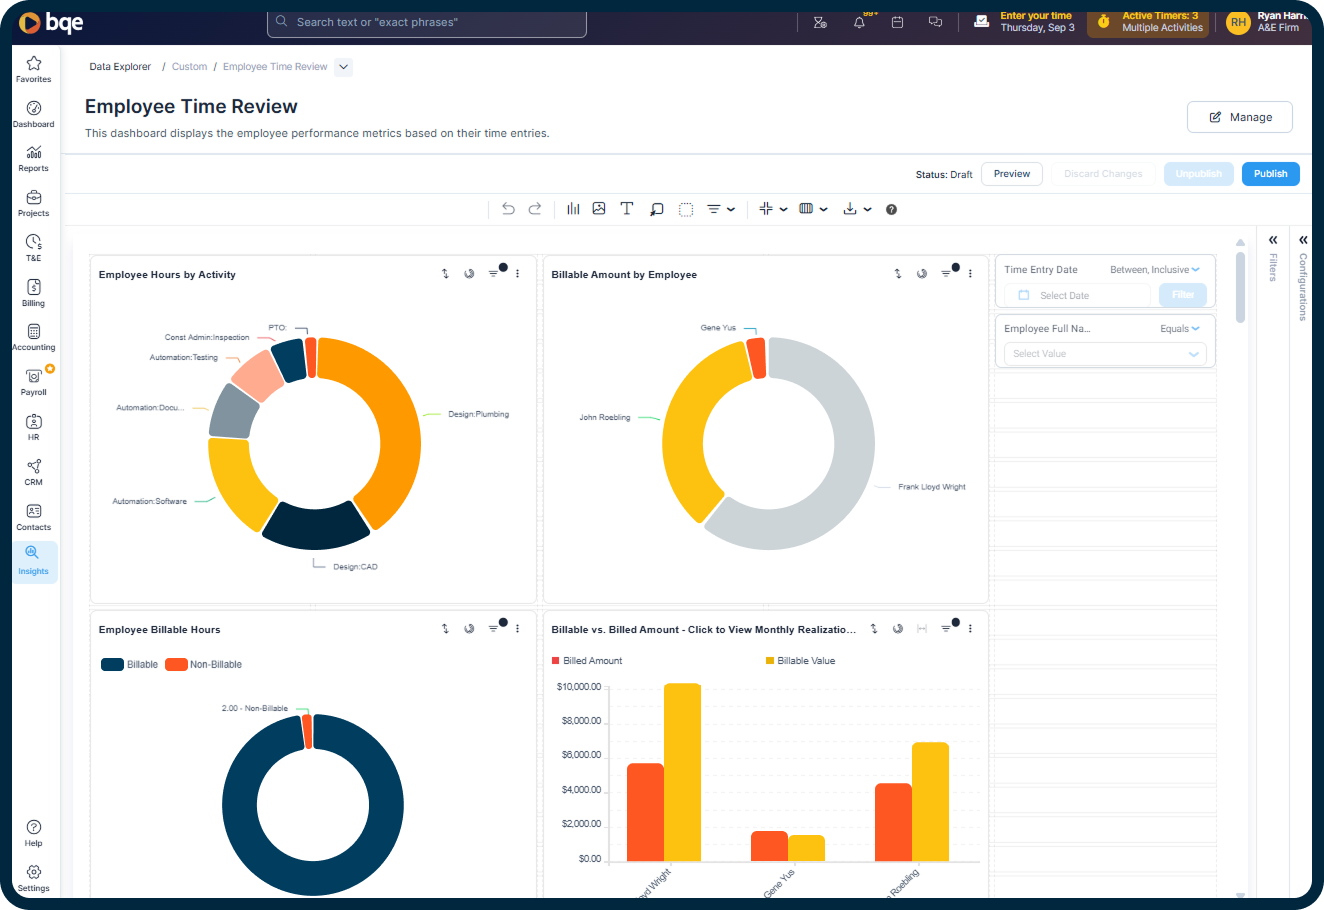
  • Where is my team's time actually going?
    See utilization and time entry compliance by person, project, or phase. No chasing required.

  • What questions do you need answered?
    Insights visualizes the numbers you need, customized for how you want to see them. Each firm is unique, and now you have the tool to unleash your data. 


The Result?

cog-automation

Smarter Decisions. Better Strategy.

No more leading with gut instinct. Insights gives you a clear, current view of your firm's performance, so every strategic call, big or small, is grounded in what the data actually shows.
payment-cash

Know Your Numbers. Grow Your Profit.

Profitability shouldn't be a mystery you solve at year end. Insights connects project performance to firm health in real time, so leaders always know exactly how the business is doing and where to focus to improve it.
laptop-project-screen

See It Coming. Act Before It Costs You.

Small issues become expensive ones when they go unnoticed. Insights helps you flag underperforming projects and scope creep as they happen, giving your team the chance to course-correct before a problem turns into a write-off.
time-lapse

Less Busywork. More Time Back.

Building reports by hand eats hours you don't have. Insights puts your data at your fingertips, ready to shape into exactly the view you need, without spending hours or days copying numbers into a spreadsheet or piecing together a report from scratch.
tickmark

One Number. No More Debate.

When every department and role pulls from a different spreadsheet, nobody fully trusts the numbers. Insights gives your whole firm one shared, reliable view of performance, so decisions are made on agreement, not guesswork.
user-group

Clear Visibility. Aligned Teams.

Accountability starts with visibility. When performance is clear to everyone, from project managers to principals, teams stay aligned on what matters and take ownership of the results.

What your firm looks like with Insights...

Instead of...
You get...
Exporting data into spreadsheets to build the report you actually need
Customizable views, built from your live data, directly within CORE
Waiting days for someone to pull and format a report
Real time answers, available the moment you need them
Reconciling different numbers from different tools and departments
One shared, reliable source of truth for the whole firm
Static reports that are outdated as soon as they're exported
Live dashboards that always reflect where things stand right now
A generic reporting tool that needs heavy setup to fit A&E work
Views and metrics built specifically for how A&E firms operate
Digging through multiple systems to understand project performance
Project and firm performance in one place, side by side
Reporting that only your admin team knows how to build or maintain
An intuitive experience any team member can use without training
“If you can’t tell me the relationship between your costs, your projected revenue, or your work in progress right now, you’re already behind. That’s where so many firms stumble. They’re operating off old numbers or waiting for month-end reports. CORE gives us real-time data and clarity to make calls instantly. It keeps our leadership team aligned, our staff accountable, and our business moving forward with confidence.”
Sean Cristea - Headshot
Sean Cristea
CFO | Cuschieri Horton Architects

Ebook: The Insight Advantage

This ebook shows how leading A&E firms are using flexible, deeper analysis to uncover hidden patterns, avoid costly mistakes, and make more confident decisions that improve profitability and growth.

FAQs

Have other questions about Insights?
Call us today.

What is Insights?

Insights is a data processing and visualization tool within BQE CORE that gives A&E firms a real-time view of project and firm performance. Think of it as a replacement for things like Power BI or customized spreadsheets. It replaces manual report building with customizable views built directly from your existing data. The interface allows you to pull the metrics you are interested in and build compelling charts, graphs, and equations to visualize the information you need to make better business decisions. 

Who is Insights built for?

Insights is designed for both firm leaders who need a clear picture of overall performance and the administrators and project managers who need detailed, day-to-day reporting. Everyone gets access to the information they need for their role, from a shared, up-to-date dataset that becomes your firm's source of truth. 

Is Insights part of BQE CORE, or a separate product?

Insights is an add-on to CORE, not a standalone product. It runs on your live CORE data, so there is nothing to export, nothing to sync, and no second system to maintain.

How is Insights different from a spreadsheet or third party data analytics tool?

Spreadsheets and third party tools require you to export data, keep it updated, and rebuild reports every time something changes. Insights runs directly on your live CORE data, so there is nothing to export, nothing to sync, and no second system to maintain. What you see always reflects where your projects and firm stand right now, not a snapshot from the last time someone updated a file.

Insights is also built specifically for A&E firms, so the views and metrics are already relevant to how your firm operates, rather than a generic dashboard you have to configure from scratch to make sense for project based work.

How quickly can our firm get up and running with Insights?

Because Insights runs directly within CORE, on your existing CORE data, there is no data migration, export, or separate setup process to get through first. As soon as Insights is added to your subscription, it works with the project, financial, and time data already in CORE, so your firm can start viewing performance without a lengthy implementation process. Plus, it was designed for anyone to use, so you don't need extensive training, consultants, or coding knowledge to start building your own dashboards right away. Get the answers you need in minutes. 

Do I need to build reports from scratch?

No. Your data is already organized and ready to view, in pre-built dashboards. However, the true power is giving you the control to manipulate your data to answer the unique questions your firm wants answered.  You can shape it into the report or dashboard you need without copying numbers into a spreadsheet or exporting into a third-party tool. It is fully customizable and is intuitive to use. New dashboards can be built in minutes, without needing to understand coding or hiring a consultant. 

Can I customize what I see?

Yes. Insights is built to adapt to how you work, so leaders and administrators can each configure views that match their role, whether that is firm-wide performance or project-level detail. Plus, each view you create can be saved and shared with the right people at your firm. 

How current is the data in Insights?

Insights pulls from real-time data within BQE CORE, so what you see reflects where your projects and firm stand right now, not a snapshot from last week or last month. Because you don't have to copy and paste into a spreadsheet or export to a third-party tool, you are getting the most accurate view of your firm's data at all times. 

Does Insights replace the reports I already use?

For most firms, yes. Insights is designed to eliminate the need for manually built reports, expensive custom reporting, or outside tools, giving your whole firm one shared, reliable source of truth. But the other reporting tools and dashboards in CORE remain. So if you have reports that you rely on today, they are still available to you. Insights simply gives you a new way to manipulate and view your firm's data. 

How much does Insights cost?

Insights is available for one fixed annual price. Unlimited users. No per-seat math, no Power BI specialist, no expensive consultants, and no hidden fees. If someone needs an answer, they get it.

Ask your BQE Account Manager to learn more and see if Insights is the right fit for your firm. 

Unleash your data and drive smarter decisions.

Firms that stay ahead are those that use data to drive better business strategies. Ask your BQE Account Manager for a live demo of Insights today.