

Learn how to calculate architecture KPIs that offer data-driven insights into firm, team, and manager performance. Get formulas, examples, and benchmark ranges from trusted sources. Download free KPI worksheets to start tracking results.
Inside This Article
- Architecture firm KPI formulas, examples, and benchmarks
- Architecture Team/Department KPIs
- Architecture Manager KPIs
- Architecture KPI cheat sheets for firms, teams, and managers
- What good architecture benchmarks look like
Article Summary
Architecture KPIs (Key Performance Indicators) provide a framework for evaluating financial health, project delivery, and operational performance for firms, teams, and managers. Firm-level KPIs track profitability, overhead, realization rates, revenue growth, and cash flow, to name a few. Team KPIs focus on resource use, utilization, delivery accuracy, quality, and client satisfaction. Manager KPIs measure planning accuracy, workload balance, retention, forecasting, and delivery predictability. Formulas and benchmark ranges support consistent measurement, while performance assessment depends on project type, firm structure, and strategic intent. KPI tracking helps identify risk, guide decisions, and improve outcomes over time.
Why Architecture Firms and Teams Need Sharp KPIs
Architecture KPIs track key variables that show whether a firm is meeting its business goals and where it can improve. They often measure profitability, efficiency, budgeting, and delivery. Strong firms strategically track the KPIs most relevant to their goals and key questions.
Key performance indicators (KPIs) tie directly to business goals, in contrast with general metrics, such as project costs or billable hours, that describe what is happening. For example, firms may use KPIs to track profit per employee, overhead costs, team time allocation, or the accuracy of project planning and budgeting.
You can compare your KPI performance against industry benchmark ranges compiled from many firms. These ranges identify low, average, and high-performing values. Benchmarks provide context and guidance.
In general, most architecture firms track about 10 core KPIs to assess overall performance, plus an additional five to eight KPIs for each team or manager. The exact number will vary by firm based on its goals, size, operating model, and strategy. What matters most is that every KPI serves a clear purpose and directly supports decision-making.
Strong firms track both leading and lagging KPIs to guide decisions and assess their impact on the business.
- Leading indicators track activities or conditions that signal future performance, such as growth trends, upcoming workload, or expected billable hours. For example, insight into future projects or anticipated billable time helps a firm estimate its financial position before results are reflected in actual revenue. Firms use leading indicators to anticipate outcomes and adjust their actions early, either to reduce risk or to capitalize on emerging trends.
- Lagging indicators measure results that reflect past performance. These KPIs indicate whether teams met goals for revenue, client retention, profit margin, or employee turnover. Firms review lagging indicators to evaluate outcomes and identify areas for improvement.
Experts caution that while KPIs and benchmarks are valuable, the strongest firms treat them as part of a larger, firm-specific strategy.
|
Douglas Teiger, FAIA, founder at Teiger Consulting "Benchmarks are useful because they show you how you compare against industry standards, but meeting those numbers is not the goal in and of itself. In architecture, KPIs are always context-dependent. They shift based on the project, the type of firm, and the strategy you’re pursuing. I don’t see them as numbers you need to hit, but as tools for building a stronger firm. Sometimes it fine to fall behind on a KPI, as long as you’re clear about what you’re doing and why.”
|
Steven Burns, FAIA, founder at The Well-Designed Firm “My general attitude about KPIs is to monitor your own results and work toward improvement, rather than solely focusing on what other firms are reporting or only comparing your numbers to the industry averages. Still, simply asking your staff to stop and deliver KPIs means they have to stop and think. In many of these cases, the saying ‘what gets measured gets managed’ really works. KPIs are useful for gauging internal progress at the firm or team level.” |


For more, see how to use architecture KPIs to track performance and trends and make data-driven decisions.
Architecture Firm KPI Formulas, Examples, and Benchmarks
Architecture firm KPIs track how the firm is performing at the business level. They measure variables like profit margin, labor efficiency, and billable hours. They provide a firmwide view of results that helps leadership monitor financial health, spot issues early, and make informed decisions that support long-term goals.
Many architecture firms standardize their coding and reporting of financial activity using frameworks such as the AIA Chart of Accounts and guidance from the AIA Best Practices Series or other Industry Benchmarking Reports. That consistency makes it easier to track firm-level KPIs for revenue, labor, and expenses.
The following sections outline common firmwide benchmarks and the formulas used to calculate them. To learn more, get the free BQE Architecture Benchmarking Report. Also, read our article on how to use KPI benchmarking to get the most insight out of your tracking efforts.
Architecture Operating Profit Margin
This KPI measures the percentage of revenue remaining after paying all operating expenses, including employee salaries. It is a core benchmark for evaluating a firm’s profitability and expense management relative to revenue. It doesn’t include expenses from interest on debt or taxes. Some may refer to this as EBITDA.
Architecture Operating Profit Margin Formula: (Net Revenue – Net Expenses) ÷ Net Revenue × 100
A firm earning $10 million in revenue with $1.9 million in profit after all expenses has an operating margin of 1.9M ÷ 10M × 100 = 19%. This indicates they have 19% of revenue remaining after overhead and direct labor expenses.
Architecture Operating Profit Margin Benchmark Range
- Average: 19.9%
- Typical Range: 11–33%
- High Performance: 24%+
Source: BQE 2025 Architecture Benchmarking Report, Profit %
Architecture Net Multiplier
The architecture net multiplier is a core KPI that shows how many dollars a firm earns for every dollar spent on billable labor for a client project. Most firms track this KPI to understand how effectively project labor converts into revenue.
You may also hear people refer to this KPI as a direct labor multiplier or multiplier achieved. Because the net multiplier focuses on revenue from direct labor, firms typically exclude subconsultant pass-through costs and reimbursable expenses to avoid overstating performance.
Architecture Net Multiplier Formula: Net Revenue ÷ Direct Labor Cost
If an architecture firm generates $1,950,000 in net revenue and incurs $650,000 in direct labor costs (the amount paid for salaries spent on billable work, calculated by taking your total salary expense and multiplying it by your firm's utilization rate) for design and documentation work, the net multiplier is 1,950,000 ÷ 650,000 = 3.0. This falls within the typical industry range and indicates the firm is performing at an average level in converting labor into revenue.
Architecture Net Multiplier Benchmarking Range
-
Average: 3.1
-
Typical Range: 2.4–3.9
- High Performance: 3.3+
Source: BQE 2025 Architecture Benchmarking Report, Billing Multiplier
Architecture Break-Even Multiplier (or Breakeven Rate)
The break-even multiplier calculates the multiple of labor costs a firm must bill to cover its operating costs and break even. It helps firms determine the hourly rate they should charge to cover expenses or generate profit.
Architecture Break-Even Multiplier Formula: Net Expenses ÷ Direct Labor Costs
If a firm has $2.6 million in net expenses and $1.0 million in direct labor costs, the break-even multiplier is $2.6M ÷ $1.0M = 2.6. This means the firm must bill about $2.60 for every $1.00 of direct labor just to cover its operating costs. This KPI provides leadership insight into how much they need to charge to achieve profitability. Every firm leader should know this number off-hand.
Architecture Break-Even Multiplier Benchmarking Range
- Average: 2.59
- Typical Range: 3.2–1.9
- High Performance ≤2.4
Source: BQE 2025 Architecture Benchmarking Report, Break-Even Multiplier
Architecture Overhead Multiplier (or Overhead Rate)
This metric shows how much a firm spends on indirect overhead expenses per dollar spent on direct labor. It helps explain how much above an employee’s base cost the firm must charge to cover indirect labor allocation, such as operating and administrative expenses.
Architecture Overhead Multiplier Formula: Overhead Expenses ÷ Direct Labor Cost (or Break-even Rate - 1)
If your overhead totals $100,000 and direct labor costs $80,000, the overhead multiplier is $100,000 ÷ $80,000 = 1.25. That means that for every $1 the firm spends on direct labor, it incurs $1.25 in overhead expenses.
Architecture Overhead Multiplier / Overhead Rate Benchmark Range
-
Average: 1.5
-
Typical Range: 2.2–0.9
-
High Performance ≤1.5
Source: BQE 2025 Architecture Benchmarking Report, Overhead Multiplier
Architecture Days Sales Outstanding (DSO)
Days sales outstanding (DSO), also called average collection period or accounts receivable (A/R) days, calculates how many days it takes for a firm to collect payments from its clients. It helps a firm assess its cash flow and highlights any collection concerns that could affect its bottom line.
Many firms use accrual-basis revenue recognition to record revenue as services are delivered, even if the client has not yet paid. This approach helps distinguish between earned and unearned revenue and track work-in-progress (WIP) earnings, which represent the value of completed work the firm has not yet billed. Alongside DSO, it helps firms assess cash flow health and identify billing issues before they have a broader impact. To improve cash flow, some firms use retainer and advance billing to collect payments before or during work.
Architecture Days Sales Outstanding (DSO) Formula: (Accounts Receivable ÷ Annual Credit Sales) × 365
If accounts receivable total $1 million and annual sales are $10.4 million, AR Days = 1M ÷ 10.4M × 365 ≈ 35.1 days. This means the firm, on average, takes 35 days to receive payments from clients after issuing invoices.
Architecture Days Sales Outstanding (DSO) Benchmark Range
- Average: 49.4
-
Typical Range: 27.0–65.7
-
High-performance: ≤44.8 days
Source: BQE 2025 Architecture Benchmarking Report, Average Collection Period
Architecture Revenue Growth Rate
Revenue growth rate measures whether a firm’s revenue increased or decreased compared to the prior year. It serves as a core indicator of business health and market demand. A positive rate shows growth, while a negative rate signals issues leadership must address to maintain profitability.
Architecture Revenue Growth Rate Formula: (Current Period Revenue − Prior Period Revenue) ÷ Prior Period Revenue × 100
If annual revenue increases from $12.0 million to $12.8 million, the growth rate is (12.8M −12.0M) ÷ 12.0M × 100 ≈ 6.4%. This means that the firm’s revenue grew by 6.4% from the previous year, which represents a steady, typical pace of growth for an architecture firm.
Architecture Revenue Growth Rate Benchmarking Range
-
Average: 6.40%
-
Typical Range: –17% to 21%
-
High Performance: ≥ 5%
Source: BQE 2025 Architecture Benchmarking Report, YoY Revenue Growth
Architecture Proposal Win Rate (Bid-to-Win)
The proposal win rate measures the percentage of projects a firm wins relative to the number of bids it submits. It shows how effectively the firm bids for work, how competitive the market is, and whether the firm prices its services appropriately and targets the right projects.
Architecture Proposal Win Rate Formula: Number of Wins ÷ Number of Proposals Submitted × 100
If a team submits 10 proposals and wins 3, the win rate is 3 ÷ 10 × 100 = 30%. This means that the firm is securing about 30% of the projects it bids for.
A good target is to convert about 33% of proposals sent into signed contracts. Although some firms want this to be much higher. I've worked with some firms that wanted to see this at about 50%. This can vary a lot from firm to firm or based on the type of projects you pursue. So look through your historical data to find a good average target for your firm.
Not included in the BQE Benchmarking Report, but still worth tracking for your firm.
Architecture Revenue per Full-Time Employee
Revenue per full-time employee measures the average revenue a firm generates for each employee. Pretty self-explanatory. This KPI helps firms assess staffing efficiency and workload balance. It also highlights whether the firm needs to hire, has excess capacity, charges limited fees, or has a workforce geared toward non-billable tasks.
Architecture Revenue per Full-Time Employee Formula: Net Revenue ÷ Total Number of Full-Time Employees
A firm generating about $10,000,000 in annual revenue with 50 employees has a revenue per employee of $10.0M ÷ 50 = $200,000. This reflects an excellent billing level per staff member compared with the industry standard.
Architecture Revenue per Full-Time Employee Benchmark Range
-
Average: $170,478
-
Typical Range: $112,358–$203,304
-
High Performance: $170,000+
Source: BQE 2025 Architecture Benchmarking Report, Revenue per Full-time Employee
Expense per Full-time Employee
This KPI measures how much a firm spends per full-time employee. It helps firms assess whether they are using their resources efficiently and how much it costs to support each employee. Most firms use it, along with revenue per full-time employee, to assess whether their operations are efficient and profitable.
Architecture Expense per Full-Time Employee Formula: Net Expenses ÷ Total Number of Full-Time Employees
A firm with $5.0 million in annual net expenses and 50 employees has net expenses per employee of $5.0M ÷ 50 = $100,000. This value reflects the average amount the firm spends per employee and provides insight into operating profits and costs.
Architecture Expenses per Full-Time Employee Benchmark Range
-
Average: $131,025
-
Typical Range: $88,265–$135,645
-
High Performance: ≥ $107,204
Source: BQE 2025 Architecture Benchmarking Report, Expense per Full-time Employee
Architecture Utilization Rate (Individual)
The utilization rate measures how much time employees spend on billable work, such as design and project tasks, instead of non-billable activities like meetings, training, or administration. This KPI shows how efficiently a firm allocates employee time to client project work.
Billable rate structures define how an architecture firm sets hourly rates across roles and service types. Because those rates vary widely, utilization alone does not show financial impact and should be reviewed alongside billable rates and realization rates to understand how employee time translates into revenue.
Teiger explains further: ”Utilization is a useful metric, but only when interpreted in the correct context. Because it measures billable time, different roles will naturally have very different utilization rates, and a lower number is not necessarily worse. A senior leader, for example, may have little or no billable work because their role focuses on firm management, business development, staff mentoring, and decision-making rather than project production. In that case, a low or even zero utilization rate does not indicate poor performance. Firms should set utilization targets by role and responsibility, rather than applying a single benchmark across all staff levels.”
Architecture Billable Utilization Rate Formula: Total Billable Hours Logged ÷ Total Hours Logged × 100
An architect who bills 26 of 40 total hours has 26 ÷ 40 × 100 = 65% utilization. This indicates that roughly two-thirds of their time is spent on billable work, with the remainder allocated to non-billable tasks like business development, training, reviews, management, or PTO.
Architecture Billable Utilization Rate Benchmarking Range
-
Average: 64%
-
Typical Range: 35%–85%
-
High Performance: N/A (it really depends on role)
Source: BQE 2025 Architecture Benchmarking Report, Utilization Rate
Architecture Backlog Percentage
The backlog percentage calculates the share of the firm’s revenue capacity that it has already contracted for the work but hasn't been invoiced for yet. It helps leadership understand how much work the firm has lined up. A high backlog percentage can signal room to grow, while a low backlog percentage can signal a need to downsize or pursue more work.
Architecture Backlog Percentage Formula: Backlog (in $) ÷ Annual Net Revenue (in $) × 100
If a firm has $1.2 million in contracted backlog and $4.0 million in annual net revenue, the backlog percentage is $1.2M ÷ $4.0M × 100 = 30%. This indicates that the firm has roughly four months of future work and may need to pursue additional projects.
Architecture Backlog Percentage Benchmarking Range
-
Average: 23.8%
-
Typical Range: 8%–30
-
High Performance: 30%+
Source: BQE 2025 Architecture Benchmarking Report, Backlog %.
This category needs some additional context. Many firms track backlog that includes work under contract, proposals sent, and opportunities identified. They then discount the potential revenue in each category based on conversion rates from proposals sent. So if you have $1.0M in proposals sent, and convert those at a historic rate of 30%, you could calculate these outstanding proposals as about $300,000 in backlog revenue. In our benchmarking reports, we only looked at potential revenue currently under contract and not invoiced for. So our metrics may be below some other sources that track this sort of data. In general, it is healthy to have 6+ months of work identified. If you drop too far below 6-months it may be time to consider downsizing your staff. If you have above 10+ months of work identified in your backlog, it may be time to hire.
One other consideration to keep in mind with the KPI results shown above is that the last couple of years have been challenging for the AE industry. Since COVID, it has been a very up-and-down market in a lot of sectors. The Backlog percentages are lower than I would say is healthy. So even the "high-performing" firms in the data are lower than they should be. We hope to see this significantly rise as the economy improves.
Architecture Average Contract Value
Average contract value (ACV) shows the typical revenue an architecture firm earns from each project. Firms use ACV to understand project size and staffing needs. Firms analyze it alongside proposal win rate to estimate growth potential and how many projects are needed to meet revenue targets.
Architecture Average Contract Value Formula: Total Contract Value ÷ Number of Contracts
If a firm signs 45 contracts in a year with a total contract value of $1.98 million, the average contract value is $1.98M ÷ 45 = $44,000. This value reflects a typical project size for many architecture firms and helps estimate staffing needs and annual revenue targets.
Architecture Average Contract Value Benchmarking Range:
-
Average: $51,038 (outside “Typical Range” due to outliers)
-
Typical Range: $10,887–$48,554
-
High Performance: $22,294+
Source: BQE 2025 Architecture Benchmarking Report, Average Contract Value
This is another metric that needs some context. Higher performers being lower than the average doesn't make intuitive sense, so let me explain a bit about the data set. In this set, the high-performing firms were classified as the top 25% of firms in the category. However, the data got skewed by a handful of firms that were significantly higher outliers. Plus, a lot of firms take on smaller-scale contracts that lead to larger work. For instance, you may take on a $5k or $10k feasibility study that may turn into a $500k design fee. But these smaller fees bring down the average. It is probably worth looking at the specifics of the types of projects you typically do, or project types you want to do, and then developing your own target for average contract value.
Architecture Team and Department KPI Formulas, Examples, and Benchmarks
Department and team KPIs measure how specific teams use resources, meet client needs, and deliver projects. They provide a clearer view of performance at the team level and help identify issues that firm-wide KPIs may overlook.
Architecture Resource Utilization Rate (Team-Level)
The team-level utilization rate shows the percentage of a team’s available work hours spent on billable project work. It helps firms understand how effectively a team uses its time compared with non-billable activities, such as coordination, administrative work, or training.
Architecture Resource Utilization Rate Formula: Project Hours Worked ÷ Total Available Team Hours × 100
If a team works 250 project hours out of 400 available hours, the rate is 250 ÷ 400 × 100 = 63%. This calculation means that the team is using around 63% of its time on billable tasks. Again, higher isn't necessarily better. In fact, when I see firms with a firm-wide utilization rate above, say 75%, it's probably a red flag that some important non-billable things aren't getting done. Perhaps not enough time is spent on business development, potentially leading to not enough future work. Or maybe the firm isn't investing in enough professional development, training, or mentorship for its staff. Most firms should target about 60-65% as an overall Utilization Rate.
Architecture Resource Utilization Rate Benchmarking Range
- Average: 64%
- Typical Range: 60%–70%
- High Performance: N/A (you really want to fall within the typical range here)
Source: BQE 2025 Architecture Benchmarking Report, Utilization Rate
Architecture Realization Rate
The realization rate measures how much of a team’s billable work converts into actual revenue. It reflects write-downs, billing adjustments, and differences between planned and delivered effort on fixed-fee projects, including those with phase-based schedules. This KPI helps firms assess project control, pricing accuracy, and delivery efficiency.
The realization rate depends in part on the project's contract type and fee structure. For example, on percentage-of-construction-cost projects, realization can change as scope, effort, or construction costs shift over time. Firms may also make billing realization adjustments when they write down fees, revise invoices, or absorb additional effort without billing the client, which lowers the realization rate.
This is the metric I wish more firms tracked closely. While most focus on utilization rate, partly because it's easier to track time, utilization on its own doesn't reflect actual revenue. Realization Rate is where you see what you could have earned, what you did earn, and how much money you may have left on the table. My recommendation is to make this the KPI that you track closely.
Architecture Realization Rate Formula: Net Revenue ÷ Value of Billable Work × 100
If a team produces $150,000 of billable work but only bills and collects $120,000, the rate is 120,000 ÷ 150,000 × 100 = 80%. This calculation indicates that a portion of earned fees was written off due to scope changes, fee pressure, budget overruns, or other project-related adjustments.
Architecture Realization Rate Benchmark Range
-
Average: 83%
-
Typical Range: 74%–94%
-
High Performance: ≥ 90%
Source: BQE 2025 Architecture Benchmarking Report, Realization Rate
Architecture Project On-Time Delivery Rate
This KPI measures the percentage of projects that a team completes on schedule. It provides insight into the team’s overall project management strategy, such as how well the team sets milestones, manages workloads, and anticipates delays.
According to Burns, the on-time delivery rate varies with project specifics. “Is the firm measuring the delivery of the final product, like a building, or are they measuring the deliverables by the architecture team, or even the deliverables by phase? Other factors like a change of project scope, or other client requests, can change the numbers.” He continues, adding that “the on-time delivery rate is more often a measure of how well the firm manages their clients and subcontractors rather than how they manage themselves.”
Architecture Project On-Time Delivery Rate Formula: On-Time Deliverables ÷ Total Deliverables × 100
If a team completes 65 out of 100 projects on or ahead of schedule, the on-time delivery rate is 65 ÷ 100 = 65%. This means the team delivers 65% of its projects on schedule, which may indicate challenges with project planning, coordination, or workload management.
Not included in the BQE Benchmarking Report, but worth calculating for your firm. Ideally, all of your projects are delivered on time, although that may not be realistic. Aim for 90% to start and adjust the target once you have more data around how your firm performs.
Architecture Budget Variance
Budget variance compares a project’s original budget with its actual cost at completion and shows how much the final cost differs from the plan. A positive variance signals a cost overrun, while a negative variance shows the project finished under budget. This metric helps firms evaluate cost control, scope management, and budgeting accuracy.
Burns says that this KPI can be tricky because many firms adjust the budget throughout the process, which means that the ‘original budget’ isn’t a static number fixed from day one. “A high-performing firm would continually update the budget as they work through the design process. The closer it gets to construction, the more realistic the budget. So any firm that wants to measure budget variance should understand that the original budget they suggest will change.” Still, he adds “this KPI is a great opportunity for firms to start tracking their own process so they can present budgets realistically and keep presenting them after each change in project scope, material, or quality, or at the end of each significant phase.”
Architecture Budget Variance Formula: (Actual Cost − Budgeted Cost) ÷ Budgeted Cost × 100
If a team budgets a project for $300,000 and then it ends at $325,000, the budget variance is ($325,000 − 300,000) ÷ 300,000 × 100 = 8.3% over budget. This metric means that the team went above budget.
Not included in the BQE Benchmarking Report.
Architecture Client Satisfaction (CSAT) / Net Promoter Score (NPS)
Client satisfaction scores show how clients rate quality, communication, and their experience working with the team. CSAT measures the share of clients who give positive ratings. The Net Promoter Score (NPS) shows how likely clients are to recommend the firm. Together, they reflect service quality and how well projects meet client expectations. This KPI is not common in architecture firms, but it should be. Most firms don't have a process to track this. Break this trend and set it up now. I recommend running these types of surveys at the end of each phase of a project. You can also start by surveying all of your past clients so you can start getting feedback right away.
Architecture Client Satisfaction Formula (CSAT): Number of Positive Ratings ÷ Total Ratings × 100
A team receiving 50 positive ratings out of 75 surveys has 50 ÷ 75 × 100 = 66% CSAT. That means that 66% of respondents rate the service positively.
Architecture Net Promoter Score (NPS) Formula: % Promoters − % Detractors
Net Promoter Score (NPS) measures client loyalty by asking how likely clients are to recommend the firm to others. Responses classify clients as promoters (likely to recommend), passives (neutral), or detractors (unlikely to recommend). The potential score ranges from −100 to +100, with higher scores indicating a greater likelihood that clients will recommend the firm to others.
For example, a firm surveys 75 clients. Of these, 60 respond that they are likely to recommend (‘promoters'), 10 respond that they are unlikely to recommend (‘detractors’), and 5 are neutral (‘passives’), That means that out of 75 respondents, 60 ÷ 75 × 100 = 80% are promoters, 10 ÷ 75 × 100 = 13% are detractors, and 5 ÷ 75 × 100 = 7% are passives.
Therefore, the NPS is 80% −13% = 67%, which suggests that there is a strong chance that clients would recommend the firm.
Architecture Net Promoter Score Benchmark Range
-
Average: 64
-
Typical Range: 40-65
-
High Performance: 80+
Sources: TrustMary, Bain & Co., ClearlyRated
Architecture Change Order Rate
Change order rate measures the value of change orders a project accumulates as a percentage of the original contract value. It shows how much the project scope or cost shifted after work began and helps firms evaluate their project planning, design accuracy, and coordination across different project phases.
Project delivery methods (e.g., Design–Bid–Build, Design–Build) influence change order rates because they determine when teams finalize scope and how they handle coordination and revisions during delivery. Architects usually use contract amendments to document approved change orders formally.
Other factors will influence your change order rate.
“A change order rate only means something if you understand why the change happened,” explains Teiger. “Owner-driven changes, change orders with no fault of architect or owner, and architect-driven changes are very different, and only architect-driven change orders truly reflect architectural performance. Even then, you have to separate mistakes from intentional design improvements and consider the project type. Custom, one-off projects will naturally see more change than repeat, standardized work.”
Architecture Change Order Rate Formula: (Total value of approved change orders ÷ Original contract value) × 100
If a project has an original contract value of $5,000,000 and approved change orders total $400,000, the change order rate is: $400,000 ÷ $5,000,000 × 100 = 8%
Not included in the BQE Benchmarking Report.
Architecture Manager KPI Formula, Examples, and Benchmarks
Architecture manager KPIs measure how well managers meet goals, lead teams, assign resources, and deliver projects on time and within budget. Tracking these metrics helps firms review performance, find areas to improve, and identify learning opportunities for managers.
Architecture Planning Accuracy
Planning accuracy compares planned staffing levels and timelines with actual project results. It measures how closely work aligns with the original scope, schedule, and budget. This metric shows whether a manager sets realistic expectations for project needs, costs, and deadlines.
Architecture Planning Accuracy Formula: Planned Hours ÷ Actual Hours × 100:
If an architecture manager plans 800 design hours for a project but the team ultimately spends 920 hours due to additional coordination and revisions, the planning accuracy is 800 ÷ 920 × 100 = 87.0%. This measurement reflects the accuracy with which the manager forecasts the project's needs.
No available benchmarking data.
Architecture Employee Utilization Balance
Employee utilization balance shows how managers spread work across their teams. It compares individual utilization rates to see whether some employees carry much heavier or lighter workloads than others. This metric helps managers use staff more evenly and spot overwork or underutilization early.
Architecture Employee Utilization Balance Formula: (Standard Deviation of Individual Utilization Rates)
For example, if four architects in the same role have utilization rates of 70%, 75%, 85%, and 90%, the standard deviation is 7.9%. A higher standard deviation indicates uneven workload distribution, while a lower value reflects better balance across the team. Make sure you are comparing similar roles, as utilization rates can vary greatly depending on an individual's responsibilities.
No available benchmarking data.
Architecture Team Turnover Rate
Team turnover rate measures the percentage of employees who leave a firm during a set period, usually each year. It includes both voluntary and involuntary departures and reflects staff stability, morale, and workload. High turnover may point to management or workload issues, while low turnover suggests a stable team.
Architecture Team Turnover Rate Formula: Number of Employees Who Left ÷ Total Team Members x 100
If four employees leave a 20-person team in a year, the turnover rate is (4 ÷ 20) × 100 = 20%. This metric reflects team stability and can indicate issues related to leadership, workload, or broader market conditions. Typically, a lower turnover rate is preferred.
Architecture Team Turnover Rate Benchmarking Range
-
Average: 14.1 %
-
Typical Range: 10–15%
-
High Performance: <10%
Sources: Zweig Group 2024 Financial Performance Report, AIA
Architecture Staff Retention Rate
The inverse of the turnover rate is the retention rate. Staff retention rate measures how many employees remain on a manager’s team over a given period, typically a year. It reflects the manager’s leadership, team health, workload balance, career development opportunities, and overall ability to create a stable and supportive work environment.
Architecture Staff Retention Rate Formula: (Employees at Period End − New Hires) ÷ Employees at Start × 100
If a team starts the year with 10 employees, hires one new team member, and ends the year with 9, the retention rate is (9 − 1) ÷ 10 × 100 = 80%. This means 80% of the original team members remained throughout the year.
Architecture Staff Retention Rate Benchmark Range (over a year):
- Average: 86%
- Typical Range: 85%–95%
- High Performance: 90%+
Source: Zweig Group 2024 Financial Performance Report, AIA
Architecture Training Hours per Employee
Training hours per employee measure the number of hours each employee in a team spends on professional development and continuing education. This metric reflects a manager’s investment in skill development and indicates how well a team is prepared to adopt new tasks, tools, or technologies. This is time that would show up as non-billable in a Utilization Rate calculation, but still adds tremendous value to a business over the long term.
Architecture Training Hours per Employee Formula: Total Training Hours ÷ Number of Employees
If a team logs 200 training hours across five employees, training hours per employee equals 200 ÷ 5 = 40 hours. This metric reflects how much professional development each team member receives and indicates a manager’s commitment to ongoing education and skill development.
You could also calculate this as a percentage of total time by taking the total training hours and dividing it by the total hours logged. If there are 5 employees and they each do 40 hours of training in a year, and log 2080 hours in that year, (5 X 40) / (5 X 2080) = 1.9%.
No available benchmark data.
Architecture Average Project Margin per Manager
The average project margin per manager measures the average profit margin of the projects a specific manager oversees. This metric helps assess how effectively a manager controls costs, allocates resources, and leads teams to deliver profitable work.
Architecture Average Project Margin per Manager Formula: Total Margin of Managed Projects (Project Revenue - Project Costs) ÷ Number of Projects Managed
If a manager oversees five projects that generate a combined margin of $500,000, the average project margin is $500,000 ÷ 5 = $100,000 per project. This metric shows how much profit, on average, a manager delivers per project and links leadership performance to a clear business outcome.
No available benchmark data.
Architecture Forecast Accuracy
Forecast accuracy measures how well a manager predicts project revenue. It compares the manager’s forecasted revenue to actual results. High forecast accuracy shows that the manager plans well, understands project details, and sets realistic revenue estimates.
Architecture Forecast Accuracy Formula: Forecasted Value ÷ Actual Value × 100
If an architecture manager forecasts $2.0M in project revenue for the quarter and actual revenue is $2.2M, forecast accuracy is $2.0M ÷ $2.2M × 100 = 90.9%. This metric reflects how consistently the manager estimates project scope, staffing needs, and revenue expectations.
No available benchmark data
Architecture Project Delivery Predictability
Project delivery predictability measures how often a manager completes projects on time and within budget. High predictability shows steady management and clear project planning. Low predictability may point to planning or execution problems that raise risk and costs for the firm.
Architecture Project Delivery Predictability Formula: Projects Delivered as Planned ÷ Total Projects × 100
If 10 of 15 projects meet planned timelines and budgets, predictability is 10 ÷ 15 × 100 = 66%. This gives the firm an idea of how consistently the manager delivers on time and within budget.
No available benchmark data.
Architecture KPI Formulas at a Glance:
Architecture Firm KPIs |
Architecture Department / Team KPIs |
Architecture Manager KPIs |
|
Architecture Operating Profit Margin Formula: (Net Revenue – Net Expenses) ÷ Net Revenue × 100
|
Architecture Resource Utilization Rate
Formula: Project Hours Worked ÷ Total Available Team Hours × 100 |
Architecture Planning Accuracy
Formula: Planned Hours ÷ Actual Hours × 100 |
|
Architecture Net Multiplier Formula: Net Revenue ÷ Direct Labor Cost |
Architecture Realization Rate Formula: Billed Revenue ÷ Billable Work Value × 100 |
Architecture Employee Utilization Balance Formula: Standard Deviation of Individual Utilization Rates |
|
Architecture Overhead Multiplier Formula: Overhead Costs ÷ Direct Labor Cost |
Architecture Project On-Time Delivery Rate Formula: On-Time Deliverables ÷ Total Deliverables × 100 |
Architecture Team Turnover Rate Formula: Departures ÷ Average Headcount × 100 |
|
Architecture Operating Margin Formula: Operating Income ÷ Net Revenue × 100 |
Architecture Budget Variance Formula: (Actual Cost – Budgeted Cost) ÷ Budgeted Cost × 100 |
Architecture Training Hours per Employee Formula: Total Training Hours ÷ Number of Employees |
|
Architecture Days Sales Outstanding (DSO) Formula: (Accounts Receivable ÷ Annual Credit Sales) × 365 |
Architecture Client Satisfaction (CSAT/NPS)
|
Architecture Staff Retention Rate Formula: (Employees at End – New Hires) ÷ Employees at Start × 100 |
|
Architecture Revenue Growth Rate Formula: (Current Period Revenue – Prior Period Revenue) ÷ Prior Period Revenue × 100 |
Architecture Net Promoter Score (NPS) |
Architecture Average Project Margin per Manager Formula: Total Project Margin ÷ Number of Managed Projects |
|
Architecture Proposal Win Rate (Bid-to-Win) Formula: Number of Wins ÷ Number of Proposals Submitted × 100 |
Architecture Change Order Rate Formula: Total Value of Approved Change Orders ÷ Original Contract Value × 100 |
Architecture Forecast Accuracy Formula: Forecasted Value ÷ Actual Value × 100 |
|
Architecture Expense per Full-Time Employee Formula: Net Expenses ÷ Number of FTE Employees |
Architecture Project Delivery Predictability Formula: Projects Delivered as Planned ÷ Total Projects × 100 |
|
|
Architecture Profit per Full-Time Employee Formula: Net Profit ÷ Number of FTE Employees |
||
|
Architecture Utilization Rate Formula: Billable Hours ÷ Total Available Hours × 100 |
||
|
Architecture Break-Even Multiplier |
||
|
Architecture Backlog % |
||
|
Architecture Average Contract Value |
Architecture KPI Cheat Sheets for Firms, Teams, and Managers
Our free cheat sheets give an at-a-glance overview of key KPIs that measure performance for your firm as a whole, for individual teams, and for specific managers. Enter your KPIs and compare them against benchmark ranges. For tools to actively track KPIs, try BQE CORE software or look for our architecture KPI templates, dashboards, and reports articles on our blog.
You can also use the BQE A/E Benchmarking Calculator to compare your A/E firm’s KPIs with leading industry data.
Architecture Firm KPI Cheat Sheets:
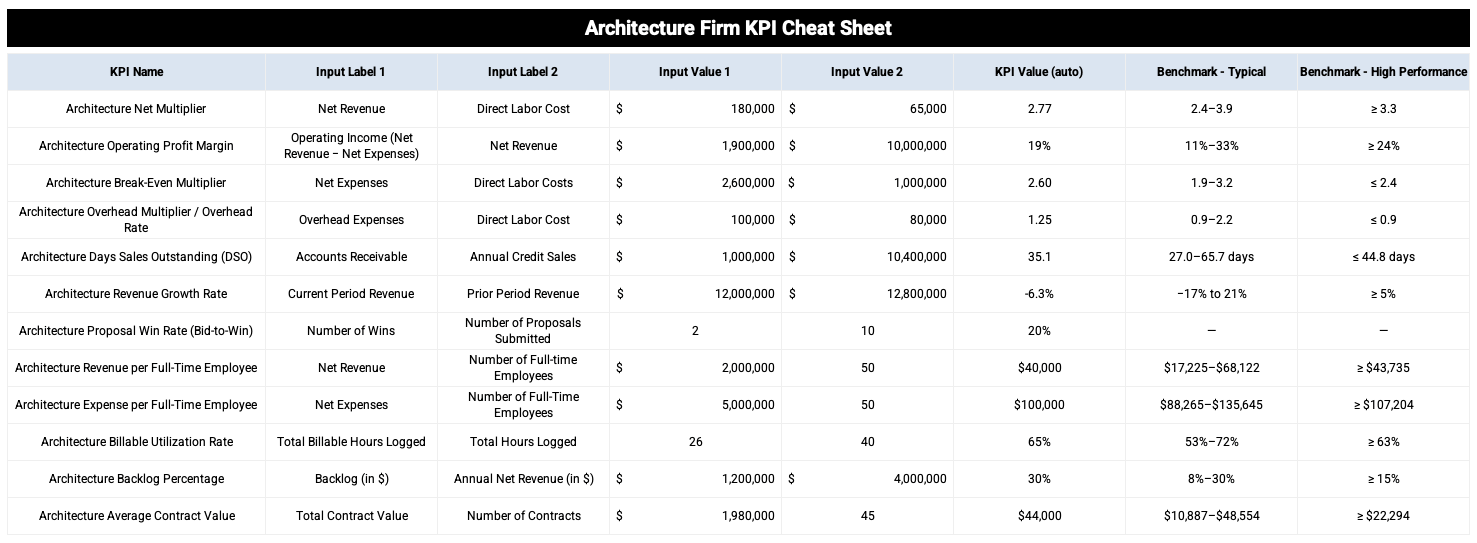
Download the Architecture Firm KPI Cheat Sheet in Excel or Google Sheets
The Architecture Firm KPI Cheat Sheet summarizes the core, firm-level metrics most architecture firms track. It includes key KPIs such as overhead multiplier, utilization rate, revenue per employee, and operating margin. Check your numbers against benchmarks to understand whether your firm meets industry standards. The sheet includes both an example tab and a blank tab.
Architecture Team/Department KPI Cheat Sheet:
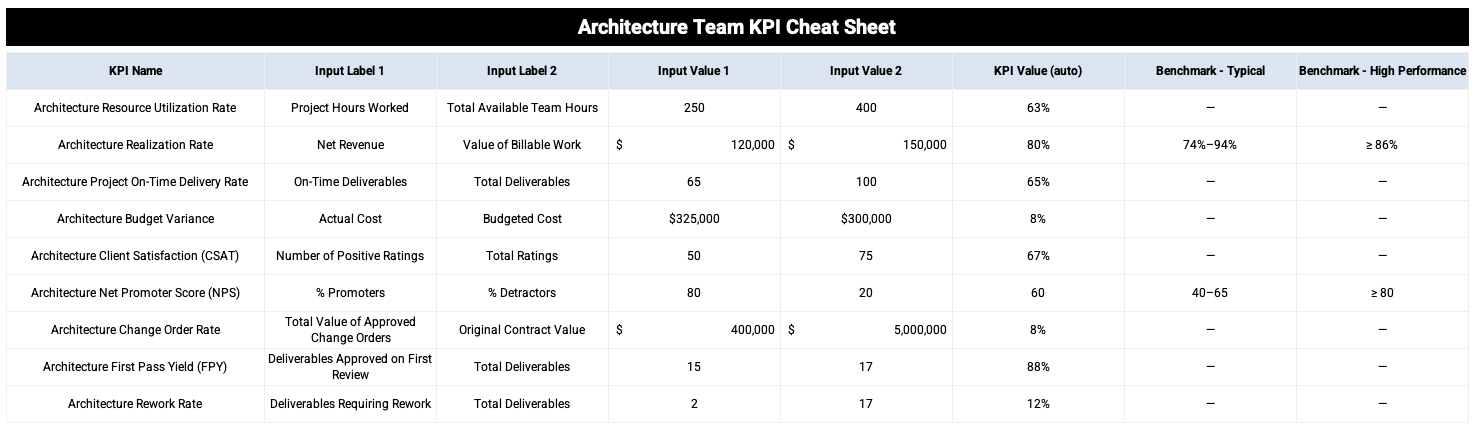
Download the Architecture Department/Team KPI Cheat Sheet in Excel or Google Sheets
The Architecture Team KPI Cheat Sheet summarizes key team-level metrics that show how effectively a team generates revenue, plans work, and forecasts resource needs. It includes core KPIs for realization, utilization, customer satisfaction, and forecasting. These KPIs help you see where your team performs well and where it can improve. This sheet has both an example tab and a blank tab.
Architecture Manager KPI Worksheet:
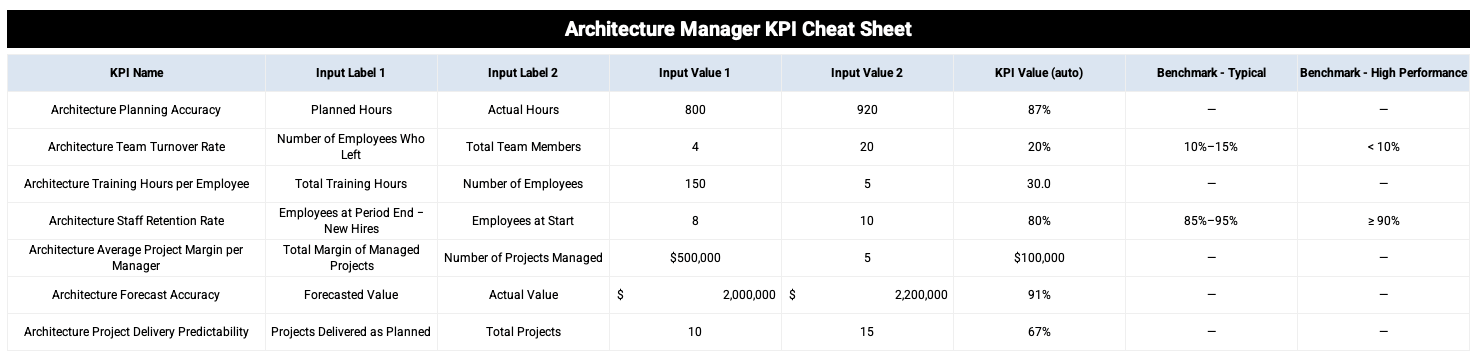
Download the Architecture Manager KPI Cheat Sheet in Excel or Google Sheets
The Architecture Manager Cheat Sheet summarizes KPIs that measure a manager’s individual performance and team management. It includes formulas and benchmarks for core KPIs such as turnover, training hours, staff retention, and accuracy. It helps managers see where they perform well and where there are growth opportunities. As with the other sheets, this one includes both an example tab and a blank tab for your entries.
Architecture Benchmarks: What ‘Good’ Looks Like
Architecture benchmarks help translate raw KPI data into a clear picture of performance by showing how your firm, teams, and managers compare to industry norms. While every firm’s context is different, high-performing organizations tend to show consistent patterns across firm-level, team-level, and manager-level metrics.
At the firm level, a strong architecture firm often shows:
- Net multipliers above 3.0
- Breakeven rates are less than 2.5. (Combined, these top two figures show that a firm converts labor into revenue efficiently.)
- Operating profit margins of around 20% or more.
- Steady year-over-year revenue growth greater than 10%
- Healthy revenue per employee of around $175,000 or more.
- Manageable days sales outstanding (DSO) of less than 45 days shows stable cash flow.
At the team or department level, high-performing groups typically have:
- A realization rate greater than 90%, showing that the team uses billable work time to deliver quality.
- Low budget variance and high planning accuracy. That shows that they deliver projects on time and close to budget expectations.
- Limited rework and change orders, which reflects the team has good project management and understands the scope of projects.
- Strong client satisfaction scores are tied to consistent project execution
At the manager level, high performance comes across in:
- High staff retention and low turnover (less than 10%)
- Balanced workloads across team members
- Profitable projects delivered predictably over time
Curious about your performance? Utilize BQE’s benchmarking calculator to see your firm's performance across these KPIs and compare your results with industry-standard benchmarks.
Track and Improve Architecture KPIs in BQE CORE
Turn data into business direction with BQE CORE. CORE automatically captures KPI data from your time, billing, project, and accounting workflows. It organizes this information in a centralized dashboard, so your team can focus on turning metrics into action.
BQE CORE’s reporting and analytics features eliminate manual spreadsheets, inconsistent formulas, and the compounding errors they introduce. Dashboards update in real time, giving leaders instant visibility into your firm’s real-time data. Identify trends, bottlenecks, and risks across projects, teams, and departments. You can compare performance across managers, track progress against targets, and drill into the drivers behind every KPI, all without having to export a file or switch across programs.
With BQE CORE, KPI insights become actionable. You can rebalance workloads, adjust fees, refine forecasts, and strengthen delivery as soon as the data changes, no month-end scramble required. It’s a faster, more accurate way to manage performance and keep projects, teams, and profit on track.
FAQ on Architecture KPIs
How do you decide which KPIs to track?
Start by defining your firm’s business goals for the next three to five years. Then identify the metrics that show progress toward those goals. Review which metrics you already track and decide which new data you need to collect going forward. When in doubt, use tools like our Benchmarking Report and track the standard KPIs used across the industry. You don't have to reinvent the wheel here.
How often should we analyze KPIs?
How often you review KPIs depends on context, including your firm’s goals, size, and pace of work. Many firms review core KPIs quarterly to spot trends, while teams and managers may review operational KPIs monthly or more often to guide day-to-day decisions. Most firms would be well served to track quarterly progress along with annual reviews of all KPIs. You can see wide variations from quarter to quarter, so an annual overview can be very helpful. Typically, you could track each KPI quarterly, looking at the past 8 quarters, and then annually, comparing each year to previous years.
When is lower KPI performance acceptable?
Lower KPI performance can make sense in certain situations. Firms may accept short-term dips during growth periods, strategic shifts, investments in training, or when taking on more complex or innovative projects. What matters is understanding the reason behind the change and confirming that results still support long-term goals. Some KPIs may be more important to you. For instance, if profitability is increasing, but a specific KPI like utilization rate is below industry average, that isn't a bad thing. In fact, that may show that you are operating more efficiently than other firms, and that your professional development or training programs are a success. KPIs are just a means to get more insight into the performance of your business and are just one tool to help see what is going on. Don't be concerned if any one metric is below average as long as overall the firm is financially profitable.
When is it appropriate to have low utilization rates?
Low utilization rates may be appropriate for senior leadership roles and for marketing, business development, and operations. These staff often spend significant time on non-billable work. As a result, firms should evaluate utilization by comparing individuals in similar roles or departments. And Utilization doesn't translate directly to profitability. It is better to have a low utilization rate but a high profit margin. It means your team is investing non-billable time wisely - perhaps by training, developing new skills, improving systems and processes to deliver value to your clients more efficiently. I'd rather see a very low utilization rate and high profitability than the other way around. Utilization rate is probably my least favorite KPI as it can be deceiving and often distracts from other metrics that are more important.
What’s the best way to track KPIs in our workflows?
The best way to track KPIs is to capture data directly from daily workflows, such as time tracking, billing, project management, and accounting. Dedicated software with automated dashboards collects KPIs consistently, reduces manual effort, and gives teams real-time visibility into performance trends as work progresses.


