


Explore the most important civil engineering KPIs to track performance, profitability, and project delivery. Get KPI formulas, examples, improvement tips, calculator cheat sheets, and a dashboard template to help your firm make better decisions.
Inside This Article:
- Financial KPIs for civil engineering firms
- Project KPIs for civil engineering departments and teams
- Civil engineering manager KPIs
- KPI calculator cheatsheets for civil engineering firms, teams, and managers
- How to build a civil engineering KPI dashboard with a template
- Streamline your civil engineering KPI tracking and dashboards
Key Performance Indicators (KPIs) for Civil Engineering
Civil engineering key performance indicators are measurable values used to evaluate a firm’s project delivery, resource management, and financial health. These KPIs connect performance to operational efficiency, profitability, and long-term growth
This article focuses specifically on civil engineering firms. Civil engineering KPIs prioritize design delivery, project lifecycle management, and client outcomes. Civil engineering performance indicators differ from general engineering KPIs, which are broader, and from civil construction KPIs, which emphasize field work, equipment utilization, and safety
Civil engineering firms operate in a design and consulting environment, and the best KPIs for such firms reflect billable work, project margins, and delivery performance. The American Society of Civil Engineers (ASCE) distinguishes engineering design and planning from construction execution, reinforcing the need for KPI frameworks that prioritize design quality, lifecycle performance, and long-term infrastructure outcomes
For a broader breakdown of engineering KPIs across disciplines, see our guide to top engineering KPIs for firms to track.
Civil Engineering KPI Formulas at a Glance
|
Category |
KPI |
Formula |
Notes |
|
Financial |
Billing Multiplier |
Net Service Revenue ÷ Direct Labor Cost |
Also called Net Multiplier Achieved |
|
Financial |
Project Profit Margin |
(Net Revenue − Total Project Costs) ÷ Net Revenue × 100 |
Also called Project Margin |
|
Financial |
Overhead Multiplier |
Overhead Costs ÷ Direct Labor Cost |
Closely related to the break-even multiplier. |
|
Financial |
Operating Margin |
Operating Income ÷ Net Revenue × 100 |
Also called Operating Profit Margin. |
|
Financial |
Revenue per Employee / Revenue per FTE |
Net Revenue ÷ Number of FTE Employees |
Also known as Revenue per Full-time Employee |
|
Financial |
Billable Utilization Rate |
Billable Hours ÷ Total Available Hours × 100 |
- |
|
Financial |
Days Sales Outstanding (DSO) |
(Accounts Receivable ÷ Annual Revenue) × 365 |
Also called Average Collection Period or AR Days. |
|
Financial |
Revenue Growth Rate |
(Current Period Revenue − Prior Period Revenue) ÷ Prior Period Revenue × 100 |
YoY Revenue Growth |
|
Financial |
Civil Engineering Backlog |
Total Contracted Revenue Remaining ÷ Average Monthly Revenue |
Also called Revenue Backlog or Work Under Contract. |
|
Financial |
Proposal Win Rate |
Wins ÷ Proposals Submitted × 100 |
Also called Bid-to-Win Rate or Hit Rate. |
|
Project / Team |
Resource Utilization Rate |
Billable Hours ÷ Total Available Team Hours × 100 |
- |
|
Project / Team |
Realization Rate |
Actual Revenue ÷ Billable Value of Work × 100 |
Also called Net Realization in some firms. Measures what billed work actually becomes revenue. |
|
Project / Team |
On-Time Delivery Rate |
(Projects Delivered On Time ÷ Total Projects) × 100 |
Also called Schedule Adherence or Milestone Adherence. Especially important in publicly funded civil work. |
|
Project / Team |
Budget Variance |
(Actual Cost − Budgeted Cost) ÷ Budgeted Cost × 100 |
Also called Cost Variance % |
|
Project / Team |
Client Satisfaction (CSAT) |
Positive Ratings ÷ Total Ratings × 100 |
- |
|
Project / Team |
Change Order Rate |
Number of Change Orders ÷ Total Projects × 100 |
Also called the Scope Change Rate or Amendment Rate |
|
Project / Team |
First Pass Yield (FPY) |
Deliverables Approved on First Review ÷ Total Deliverables × 100 |
- |
|
Manager |
Planning Accuracy |
Planned Hours ÷ Actual Hours × 100 |
Also called Estimate Accuracy or Labor Planning Accuracy |
|
Manager |
Workload Balance |
Difference Between Highest and Lowest Utilization Rates |
- |
|
Manager |
Team Turnover Rate |
Departures ÷ Average Headcount × 100 |
- |
|
Manager |
Training Hours per Employee |
Total Training Hours ÷ Number of Employees |
Often tracked quarterly or annually. |
|
Manager |
Staff Retention Rate |
(Employees at Start − Departures) ÷ Employees at Start × 100 |
Inverse companion to turnover. |
|
Manager |
Average Project Margin per Manager |
Total Project Margin ÷ Number of Managed Projects |
Useful when comparing PM performance across books of work. |
|
Manager |
Forecast Accuracy |
Forecast Accuracy = [1 − (|Forecast − Actual| ÷ Actual)] × 100 |
Can be applied to revenue, labor, or earned value. |
|
Manager |
Project Delivery Predictability |
Projects Delivered as Planned ÷ Total Projects × 100 |
Broader than on-time delivery because it can include schedule and budget. |
Financial KPIs for Civil Engineering Firms
Financial KPIs for civil engineering reflect a firm’s operations and overall financial health. Top financial KPIs include billing multiplier, project profit margin, overhead multiplier, operating margin, revenue per employee, and billable utilization rate.
Civil Engineering Billing Multiplier KPI
The billing multiplier KPI, often called the net multiplier, measures how much revenue a company generates for every dollar spent on direct labor. It is a key measure of a civil engineering company’s financial performance, as it combines pricing, usage, and overhead recovery into a single number. A greater multiplier suggests that the company is making a profit while also covering its costs. A low multiplier means that you are not billing enough, not using enough, or have too much overhead.
“Many firms see a lower billing multiplier and think they may have a pricing problem. More often, they have a scope management problem,” says Austin Miller, CMO at BQE. “If you’re not tracking scope changes and aligning fees to actual delivery, your multiplier will always be under pressure. Yes, pricing is important and you should look to raise fees whenever possible, but if you aren't controling your scope any fee would be at risk.”
- Austin Miller, Chief Marketing Officer at BQE
Civil Engineering Billing Multiplier Formula
Billing Multiplier = Net Service Revenue ÷ Direct Labor Cost
Example:
-
Revenue = $1,200,000
-
Direct Labor = $400,00
-
Billing Multiplier = 1,200,000 ÷ 400,000 = 3.0
According to the BQE 2025 Engineering Benchmarking Report, the average net multiplier across engineering firms, including civil and other types, is about 3.2, with high-performing firms consistently exceeding 3.3.
Actions to Improve Civil Engineering Billing Multiplier
The best way to enhance this KPI is to ensure that prices cover delivery expenses. In competitive public bidding scenarios, many civil businesses bid too low on their work. Regularly reviewing charge structures and comparing them to actual labor and expenses ensures that projects don't eat into profits.
Companies might also look at how much work they do and how big their projects are. Manage scope creep carefully, increase billable utilization, and reduce non-billable administrative work. Focused project management, especially when it comes to change orders, helps to improve the billing multiplier.
Civil Engineering Overhead Multiplier KPI
The overhead multiplier shows how much overhead cost is applied to each dollar of direct labor. It reflects the firm’s cost structure and operational efficiency. A lower overhead multiplier is generally better, as it indicates a lower indirect cost burden on projects. However, extremely low overhead can indicate underinvestment in systems, staff support, or growth capacity.
Civil Engineering Overhead Multiplier Formula
Overhead Multiplier = Total Overhead Costs ÷ Direct Labor
Example:
-
Overhead = $600,000
-
Direct Labor = $400,00
-
Overhead Multiplier = 600,000 ÷ 400,000 = 1.5
Actions to Improve Civil Engineering Overhead Multiplier
To minimize overhead, it is critical to cut costs without compromising your ability to deliver. Look at administrative expenditures, software that isn't being well-utilized, and support tasks that aren't being leveraged. You can save money by integrating tools and streamlining workflows.
At the same time, make sure that experienced employees are assigned tasks that make the most of their expertise, and that newer workers are being used efficiently. Lowering prices isn't always enough to cut overhead costs. Strategic hiring and delegation can often do more.
Civil Engineering Operating Margin KPI
The operating margin is the percentage of sales remaining after paying for both direct and indirect costs. It shows the business's overall profitability and financial health. A good operating margin means that a company is well-balanced and does a good job of pricing, controlling costs, and finishing projects. A shrinking margin is generally a sign that projects aren't working well or aren't profitable.
Civil Engineering Operating Margin Formula
Operating Margin = (Operating Income ÷ Net Revenue) × 100
Example:
-
Operating Income = $300,000
-
Revenue = $1,500,000
-
Operating Margin = (300,000 ÷ 1,500,000) × 100 = 20%
Actions to Improve Civil Engineering Operating Margin
To improve margins, it is important to both increase sales and keep costs in check. Focus on clients and projects that generate more revenue, and gradually stop doing work that consistently generates less revenue. Not all money coming in is good money.
Make tracking project finances better. Keep an eye on budgets in real time, spot overruns early, and hold project managers accountable. Companies that look at margin every day do better than those that just look at it at the end of projects.
Civil Engineering Project Profit Margin KPI
Project profit margin evaluates profitability at the individual project level. It shows whether specific jobs contribute to or erode firm performance. This KPI is critical for identifying which project types, clients, or delivery methods are most profitable. It also helps firms refine pricing strategies and resource allocation.
Nick Heim, a civil engineer and founder of Trinovate Advisors, believes that project-level profitability is one of the most used KPIs in civil engineering.
“When PMs can see real-time margin erosion on their own projects, they start managing scope differently,” Heim says. “They push back on creep, they chase change orders, they think about pricing. It turns a project manager into a business manager. The firms I work with that made this one metric visible at the PM level saw the fastest behavioral shift.”
- Nick Heim, founder of Trinovate Advisors
Civil Engineering Project Profit Margin Formula
Project Profit Margin = (Project Revenue − Project Costs) ÷ Project Revenue × 100
Example:
-
Revenue = $200,000
-
Costs = $150,000
-
Margin = (200,000 − 150,000) ÷ 200,000 × 100 = 25%
Actions to Improve Civil Engineering Project Profit Margin
The biggest concern with this KPI is scope control. Many civil engineering projects lose margin due to untracked or uncompensated scope changes. Implement and monitor strict change-order processes, and train project managers to enforce them.
Much can also be done in the project planning phase. Better upfront scheduling, staffing, and risk assessment all help reduce costly surprises. Post-project reviews can reveal patterns that help improve margins to apply to future projects.
Civil Engineering Revenue per Employee KPI
Revenue per employee measures how efficiently a firm generates revenue relative to its workforce. It is a key indicator of productivity and scalability. Higher revenue per employee typically indicates strong utilization, efficient processes, and effective staffing. Lower values may point to overstaffing or underutilization.
Civil Engineering Revenue per Employee Formula
Revenue per Employee = Total Revenue ÷ Number of Employees
Example:
-
Revenue = $3,000,000
-
Employees = 15
-
Revenue per Employee = 3,000,000 ÷ 15 = $200,000
Actions to Improve Civil Engineering Revenue per Employee
Improvement of this KPI begins with utilization. Ensure technical staff spend the majority of their time on billable work. Reduce administrative burdens through automation and better systems.
Additionally, align staffing with demand. Avoid overhiring during growth phases and instead use contract staff where possible to retain payroll flexibility. High-performing firms scale deliberately, not reactively.
Civil Engineering Aged Accounts Receivable (Days) KPI
Aged AR days (also called Days Sales Outstanding) measures how long it takes to collect payment after invoicing. It directly impacts cash flow and financial stability. Lower AR days indicate efficient billing and collections. Higher values suggest delays, disputes, or weak invoicing processes.
Civil Engineering Aged AR Formula
AR Days = (Accounts Receivable ÷ Annual Revenue) × 365
Example:
-
Accounts Receivable = $500,000
-
Revenue = $3,000,000
-
AR Days = (500,000 ÷ 3,000,000) × 365 = 61 days
Actions to Improve Civil Engineering Aged AR
Focus on invoicing. Send invoices immediately upon milestone completion and ensure they are clear, detailed, and aligned with contract terms. Delayed or confusing invoices slow payment.
Another approach is to strengthen follow-up processes. Assign responsibility for collections, automate reminders, and proactively communicate with clients. Firms that treat collections as a priority, not an afterthought, consistently outperform their peers.
Civil Engineering Revenue Growth Rate KPI
Revenue growth rate measures how quickly a firm’s revenue is increasing over time. It reflects market demand, business development success, and the firm's overall trajectory. Consistent, sustainable growth is ideal. Rapid growth without operational capacity can pose risks, while stagnation may signal competitive or strategic issues.
Civil Engineering Revenue Growth Rate Formula
Revenue Growth Rate = [(Current Period Revenue − Prior Period Revenue) ÷ Prior Period Revenue] × 100
Example:
-
Current Revenue = $4,000,000
-
Prior Revenue = $3,500,000
-
Revenue Growth Rate = (500,000 ÷ 3,500,000) × 100 = 14.3%
Actions to Improve Civil Engineering Revenue Growth Rate
Focus on expanding existing client relationships through additional services, phases, or geographic reach. Sustainable growth requires a balance of new business and repeat work. Strong client relationships drive revenue growth, especially in civil engineering, where long-term contracts and repeat municipal work are common.
Improve your pursuit strategy. Track proposal win rates, target higher-value opportunities, and prioritize projects where your firm has a clear competitive advantage. Growth should be intentional, not just the result of chasing more work.
Civil Engineering Backlog KPI
Backlog measures the amount of contracted work a firm has yet to complete, typically expressed in months of revenue. It is one of the most important leading indicators of financial stability and future workload in civil engineering firms. A strong backlog indicates predictable revenue and growth potential, while a declining backlog signals risk to staffing and cash flow.
Civil Engineering Backlog Formula
Backlog (Months) = Total Contracted Revenue Remaining ÷ Average Monthly Revenue
Example:
-
Backlog = $9,000,000
-
Monthly Revenue = $1,000,000
-
Backlog = 9 months
Actions to Improve Civil Engineering Backlog
Improving backlog is about consistent business development, not last-minute project chasing. Stable backlog pipelines support long-term client relationships, repeat work, and targeted pursuits rather than relying solely on competitive bids. Public sector work can provide multi-year stability when managed strategically.
Track proposal volume, win rates, and expected start dates to understand how future work converts into backlog. A strong proposal pipeline without conversion discipline won’t translate into real backlog. Balance is critical. Too little backlog creates revenue risk, while too much can strain staffing and reduce delivery quality. Align backlog targets with hiring plans and resource capacity so growth remains sustainable.
Civil Engineering Proposal Win Rate (Hit Rate) KPI
Proposal win rate measures the percentage of submitted proposals that result in awarded projects. It reflects the effectiveness of business development efforts. A higher win rate indicates strong positioning, pricing, and client alignment. A low rate suggests wasted effort and misaligned pursuits.
Civil Engineering Proposal Win Rate Formula
Win Rate = (Number of Wins ÷ Total Proposals Submitted) × 100
Example:
-
Wins = 12
-
Proposals = 30
-
Win Rate = (12 ÷ 30) × 100 = 40%
Actions to Improve Civil Engineering Proposal Win Rate
Improvement starts with better pursuit selection. Focus on projects where the firm has strong relationships, relevant experience, and a competitive advantage.
Also, refine proposal quality. Tailor submissions to client needs, clearly communicate value, and involve technical experts in the process. Firms that are selective and strategic consistently achieve higher win rates.
Project KPIs for Civil Engineering Teams
Project KPIs for civil engineering teams track how effectively they deliver work on time, within budget, and on par with client expectations. Top project KPIs include on-time delivery rate, budget variance, realization rate, change order rate, and utilization rate.
Civil Engineering Project On-Time Delivery Rate KPI
On-time delivery rate measures the percentage of projects completed on schedule. It reflects planning accuracy, resource coordination, and execution discipline. A high rate indicates reliable delivery and strong client trust. A low rate may signal scheduling issues, scope creep, or resource constraints.
“Schedules don’t slip because teams don’t care,” says BQE’s Miller. “They slip because early assumptions were unrealistic. The best firms build schedules around constraints like permitting and coordination, not just internal timelines.”
Civil Engineering Project On-Time Delivery Rate Formula
On-Time Delivery Rate = (Projects Delivered On Time ÷ Total Projects) × 100
Example:
-
On-Time Projects = 18
-
Total Projects = 20
-
On-Time Delivery Rate = (18 ÷ 20) × 100 = 90%
Actions to Improve Civil Engineering Project On-Time Delivery Rate
To improve this metric, start with better upfront planning. Define realistic schedules based on past project data, not optimistic assumptions. Incorporate permitting timelines (e.g., NEPA reviews, NPDES approvals) that often delay civil projects. Improve coordination across teams. Regular progress check-ins, clear task ownership, and early identification of delays allow teams to adjust before timelines slip.
Civil Engineering Budget Variance KPI
Budget variance measures how closely actual project costs align with the planned budget. It is a key indicator of cost control and estimating accuracy. A positive variance (over budget) signals cost overruns, while a negative variance (under budget) may indicate conservative estimates or efficiency gains.
Civil Engineering Budget Variance Formula
Budget Variance = [(Actual Cost − Budgeted Cost) ÷ Budgeted Cost] × 100
Example:
-
Actual Cost = $220,000
-
Budget = $200,000
-
Variance = (20,000 ÷ 200,000) × 100 = 10% over budget
Actions to Improve Civil Engineering Budget Variance
Improve your estimating processes using historical data from similar project types (DBB, DB, CMAR). Estimating based on real performance data reduces surprises during execution. Track costs in real time. Waiting until project closeout to evaluate variance is too late. Weekly or biweekly cost tracking allows teams to correct course early.
Civil Engineering Realization Rate KPI
Realization rate measures the percentage of the firm’s billable work that is actually invoiced and collected. It captures revenue leakage due to write-offs, inefficiencies, or scope misalignment. A high realization rate indicates strong billing discipline and alignment between work performed and fees charged.
Civil Engineering Realization Rate Formula
Realization Rate = (Actual Revenue ÷ Billable Value of Work) × 100
Example:
-
Actual Revenue = $870,000
-
Billable Work = $1,000,000
-
Realization Rate = (870,000 ÷ 1,000,000) × 100 = 87%
According to BQE’s 2025 Engineering Benchmarking Report, the average realization rate across all types of engineering firms, including civil, is approximately 87%, with high-performing firms achieving 90% or higher.
Actions to Improve Civil Engineering Realization Rate
The biggest driver of realization rate is scope clarity. Clearly define deliverables upfront and align them with contract terms. Misalignment leads to write-downs later. Train project managers to bill confidently and accurately. Many firms lose revenue due to hesitation in invoicing at full value. Strong billing discipline and documentation improve realization.
Civil Engineering Change Order Rate KPI
Change order rate measures how frequently project scope changes require formal adjustments to cost or schedule. A moderate rate is expected in civil engineering due to evolving site conditions and regulatory requirements. However, a high rate can signal poor scoping or planning.
The ASCE consistently highlights planning gaps, funding constraints, and regulatory complexity as major challenges in infrastructure project delivery, all of which can contribute to scope changes and project adjustments.
Civil Engineering Change Order Rate Formula
Change Order Rate = Number of Change Orders ÷ Total Projects × 100
Example:
-
Number of Change Orders = 6
-
Total Projects = 30
-
Change Order Rate = (6 ÷ 30) × 100 = 20%
Actions to Improve Civil Engineering Change Order Rate
Improve upfront site analysis and scoping. Many change orders stem from incomplete information during project initiation. Investing more time early reduces downstream disruption. At the same time, formalize the change order process. Ensure all changes are documented, priced, and approved before work proceeds. This protects both schedule and profitability.
Civil Engineering First Pass Yield (Rework Rate) KPI
First pass yield measures the percentage of work completed correctly without requiring revisions or rework. It reflects quality control and process effectiveness. A high first-pass yield indicates efficient workflows and strong technical execution. Low values suggest recurring errors, miscommunication, or inadequate review processes.
Civil Engineering First Pass Yield Formula
First Pass Yield = Deliverables Approved on First Review ÷ Total Deliverables × 100
Example:
-
Tasks Completed Without Rework = 190
-
Total Tasks = 200
-
First Pass Yield = (190 ÷ 200) × 100 = 95%
Actions to Improve Civil Engineering First Pass Yield
Focus on quality at the source. Implement peer reviews and design checks before deliverables are finalized. Catching issues early reduces costly revisions. Standardize workflows. Templates, checklists, and QA/QC procedures help reduce variability and improve consistency across teams.
Civil Engineering Resource Utilization Rate KPI
Resource utilization measures the percentage of available staff time spent on billable project work. It is a key driver of productivity and profitability. Higher utilization indicates efficient use of staff time, while low utilization suggests underassignment or excessive non-billable work.
Civil Engineering Resource Utilization Rate Formula
Utilization Rate = (Billable Hours ÷ Total Available Team Hours) × 100
Example:
-
Billable Hours = 1,200
-
Available Hours = 1,600
-
Utilization Rate = (1,200 ÷ 1,600) × 100 = 75%
Actions to Improve Civil Engineering Resource Utilization Rate
Improve workload planning. Balance staffing across projects to avoid both overutilization and downtime. Reduce non-billable work. Streamline internal meetings, reporting, and administrative tasks so technical staff can focus on project delivery.
Civil Engineering Client Satisfaction (CSAT/NPS) KPI
Client satisfaction measures how clients perceive the firm’s performance, communication, and delivery. It is often tracked through surveys such as CSAT or Net Promoter Score (NPS). High satisfaction leads to repeat work and referrals. Low satisfaction often signals delivery or communication breakdowns.
Civil Engineering Client Satisfaction Formula
CSAT = (Satisfied Responses ÷ Total Responses) × 100
Example:
-
Satisfied Responses = 45
-
Total Responses = 50
-
CSAT = (45 ÷ 50) × 100 = 90%
Actions to Improve Civil Engineering Client Satisfaction
Focus on communication. Regular updates, clear expectations, and responsiveness are often more important than technical performance alone. Gather feedback throughout the project, not just at the end. Early feedback allows teams to adjust and improve the client experience in real time.
Civil Engineering Manager KPIs
Civil engineering manager KPIs evaluate how effectively project and team leaders plan work, manage resources, and deliver consistent results. Popular manager KPIs include planning accuracy, forecast accuracy, employee utilization balance, team turnover rate, retention rate, and average project margin per manager.
Civil Engineering Planning Accuracy KPI
Planning accuracy measures how closely project plans (schedule, budget, resources) align with actual outcomes. High accuracy indicates strong forecasting and project management discipline. Low accuracy suggests unreliable planning processes.
Civil Engineering Planning Accuracy Formula
Planning Accuracy = (Planned Hours ÷ Actual Hours) × 100
Example:
-
Planned Hours = 1,000
-
Actual Hours = 1,100
-
Accuracy = (1,000 ÷ 1,100) × 100 = 91%
Actions to Improve Civil Engineering Planning Accuracy
Use historical project data to inform estimates. Planning based on real outcomes improves reliability over time. Conduct post-project reviews. Understanding where plans deviated helps refine future estimates and improve accuracy.
Civil Engineering Forecast Accuracy KPI
Forecast accuracy measures how well managers predict future project performance, including revenue, costs, and timelines. Accurate forecasting enables better financial planning and resource allocation. Poor forecasting creates operational and financial risk.
Civil Engineering Forecast Accuracy Formula
Forecast Accuracy = [1 − (|Forecast − Actual| ÷ Actual)] × 100
Example:
-
Forecast Revenue = $500,000
-
Actual Revenue = $520,000
-
Accuracy = [1 − (20,000 ÷ 520,000)] × 100 = 96%
Actions to Improve Civil Engineering Forecast Accuracy
Update forecasts regularly. Static forecasts quickly become outdated in complex projects. Improve visibility into project performance. Real-time data on costs, progress, and risks leads to more accurate predictions.
Civil Engineering Workload Balance KPI
Workload balance measures how evenly billable work is distributed across team members. Balanced workload prevents burnout and improves overall team efficiency. Imbalance can lead to overworked staff and underutilized resources.
Civil Engineering Workload Balance Formula
Workload Balance = Difference Between Highest and Lowest Utilization Rates
Example:
-
Highest Workload Utilization = 85%
-
Lowest Workoad Utilization = 65%
-
Variance = 20% (imbalanced)
Actions to Improve Civil Engineering Workload Balance
Improve resource planning. Assign work based on capacity and skill level, not just availability. Monitor workloads regularly. Adjust assignments to maintain balance and prevent long-term inefficiencies.
Civil Engineering Team Turnover Rate KPI
Turnover rate measures how frequently employees leave the firm. It impacts continuity, productivity, and recruitment costs. High turnover can disrupt project delivery and increase costs. Low turnover supports stability and knowledge retention.
Civil Engineering Team Turnover Rate Formula
Turnover Rate = (Employees Leaving ÷ Average Total Employees) × 100
Example:
-
Employees Leaving = 3
-
Total Employees = 30
-
Turnover Rate = (3 ÷ 30) × 100 = 10%
Actions to Improve Civil Engineering Team Turnover Rate
Focus on engagement and career development. Clear growth paths and training opportunities improve retention. Ensure workload balance and compensation competitiveness. Overworked or underpaid staff are more likely to leave.
Civil Engineering Training Hours per Employee KPI
Training hours per employee measures the average amount of time each employee spends on professional development over a given period. In civil engineering firms, this KPI is often tied to maintaining licensure (e.g., PDH requirements), improving technical skills, and supporting long-term staff development. While it is not a primary financial or operational KPI, it provides useful insight into how much a firm is investing in its people and future capabilities.
Civil Engineering Training Hours per Employee Formula
Training Hours per Employee = Total Training Hours ÷ Number of Employees
Example:
-
Total Training Hours = 1,000
-
Number of Employees = 50
-
Training Hours per Employee = 1,000 ÷ 50 = 20 hours per employee
Actions to Improve Civil Engineering Training Hours per Employee
Improving this KPI starts with making training part of normal operations rather than an afterthought. Set clear expectations for annual or quarterly training targets and align them with licensure requirements and career development goals. Focus on relevance. Training should connect directly to project work, emerging technologies, or leadership development. Firms that tie training to real responsibilities see higher engagement and better outcomes.
Civil Engineering Staff Retention Rate KPI
Retention rate measures the percentage of employees who remain with the firm over a given period. It is the inverse of turnover and highlights workforce stability. High retention supports continuity and reduces hiring costs.
Civil Engineering Staff Retention Rate Formula
Retention Rate = (Employees at Start − Departures) ÷ Employees at Start × 100
Example:
-
Employees at Start = 50
-
Departures = 5
-
Retention Rate = (50 − 5) ÷ 50 × 100 = (45 ÷ 50) × 100 = 90%
Actions to Improve Civil Engineering Staff Retention Rate
Invest in culture and leadership. Employees stay where they feel valued and supported. Provide competitive compensation and meaningful work. Retention improves when employees see long-term opportunity within the firm.
Civil Engineering Average Project Margin per Manager KPI
This KPI measures the average profitability of projects managed by a specific manager. It links leadership performance directly to financial outcomes. Higher margins indicate effective management and decision-making. Lower margins may signal issues with planning, execution, or scope control.
Civil Engineering Average Project Margin per Manager Formula
Average Margin = Total Project Margin ÷ Number of Projects
Example:
-
Total Margin = $300,000
-
Projects = 10
-
Average Margin = $30,000 per project
Actions to Improve Civil Engineering Average Project Margin per Manager
Provide managers with financial visibility. Many managers lack real-time insight into project performance, limiting their ability to act. Offer training in project finance. Strong technical managers are not always strong financial managers. Bridging that gap improves outcomes across the board.
Civil Engineering KPI Cheat Sheets and Calculators by Category
These KPI cheat sheets organize the most important civil engineering metrics into firm, team, and manager categories for quick reference. Use them to standardize reporting and easily calculate your results.
Financial KPI Calculator for Civil Engineering Firms
This sheet covers KPIs for civil engineering financial performance. Enter your values and get your firm’s KPI results.
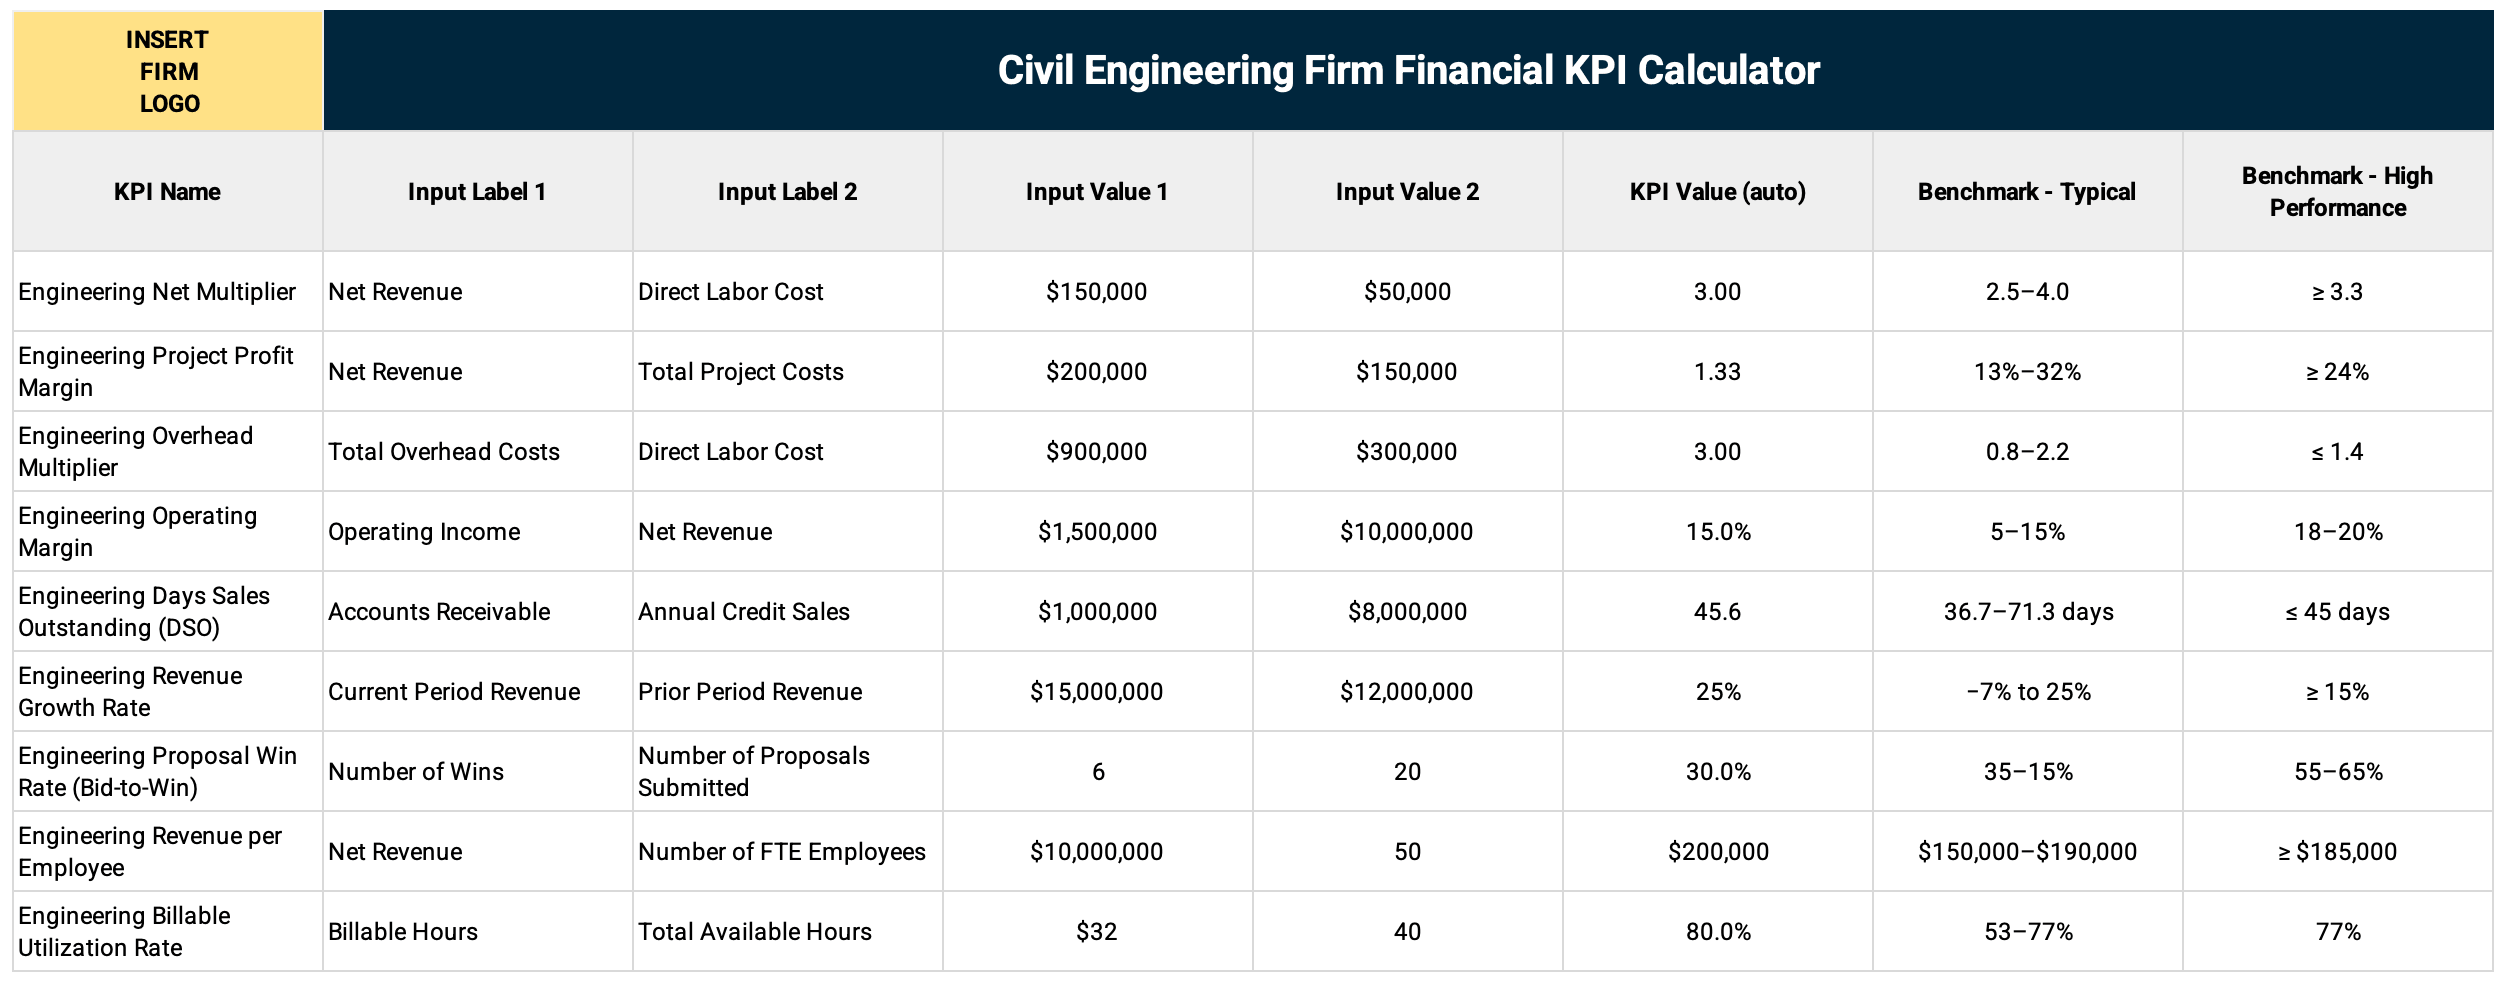
Download the Civil Engineering Financial KPI Calculator in Excel or Google Sheets
Project KPI Calculator for Civil Engineering Teams and Departments
This sheet focuses on project-level KPIs for civil engineering teams or departments. Enter your team’s numbers and get KPI results.
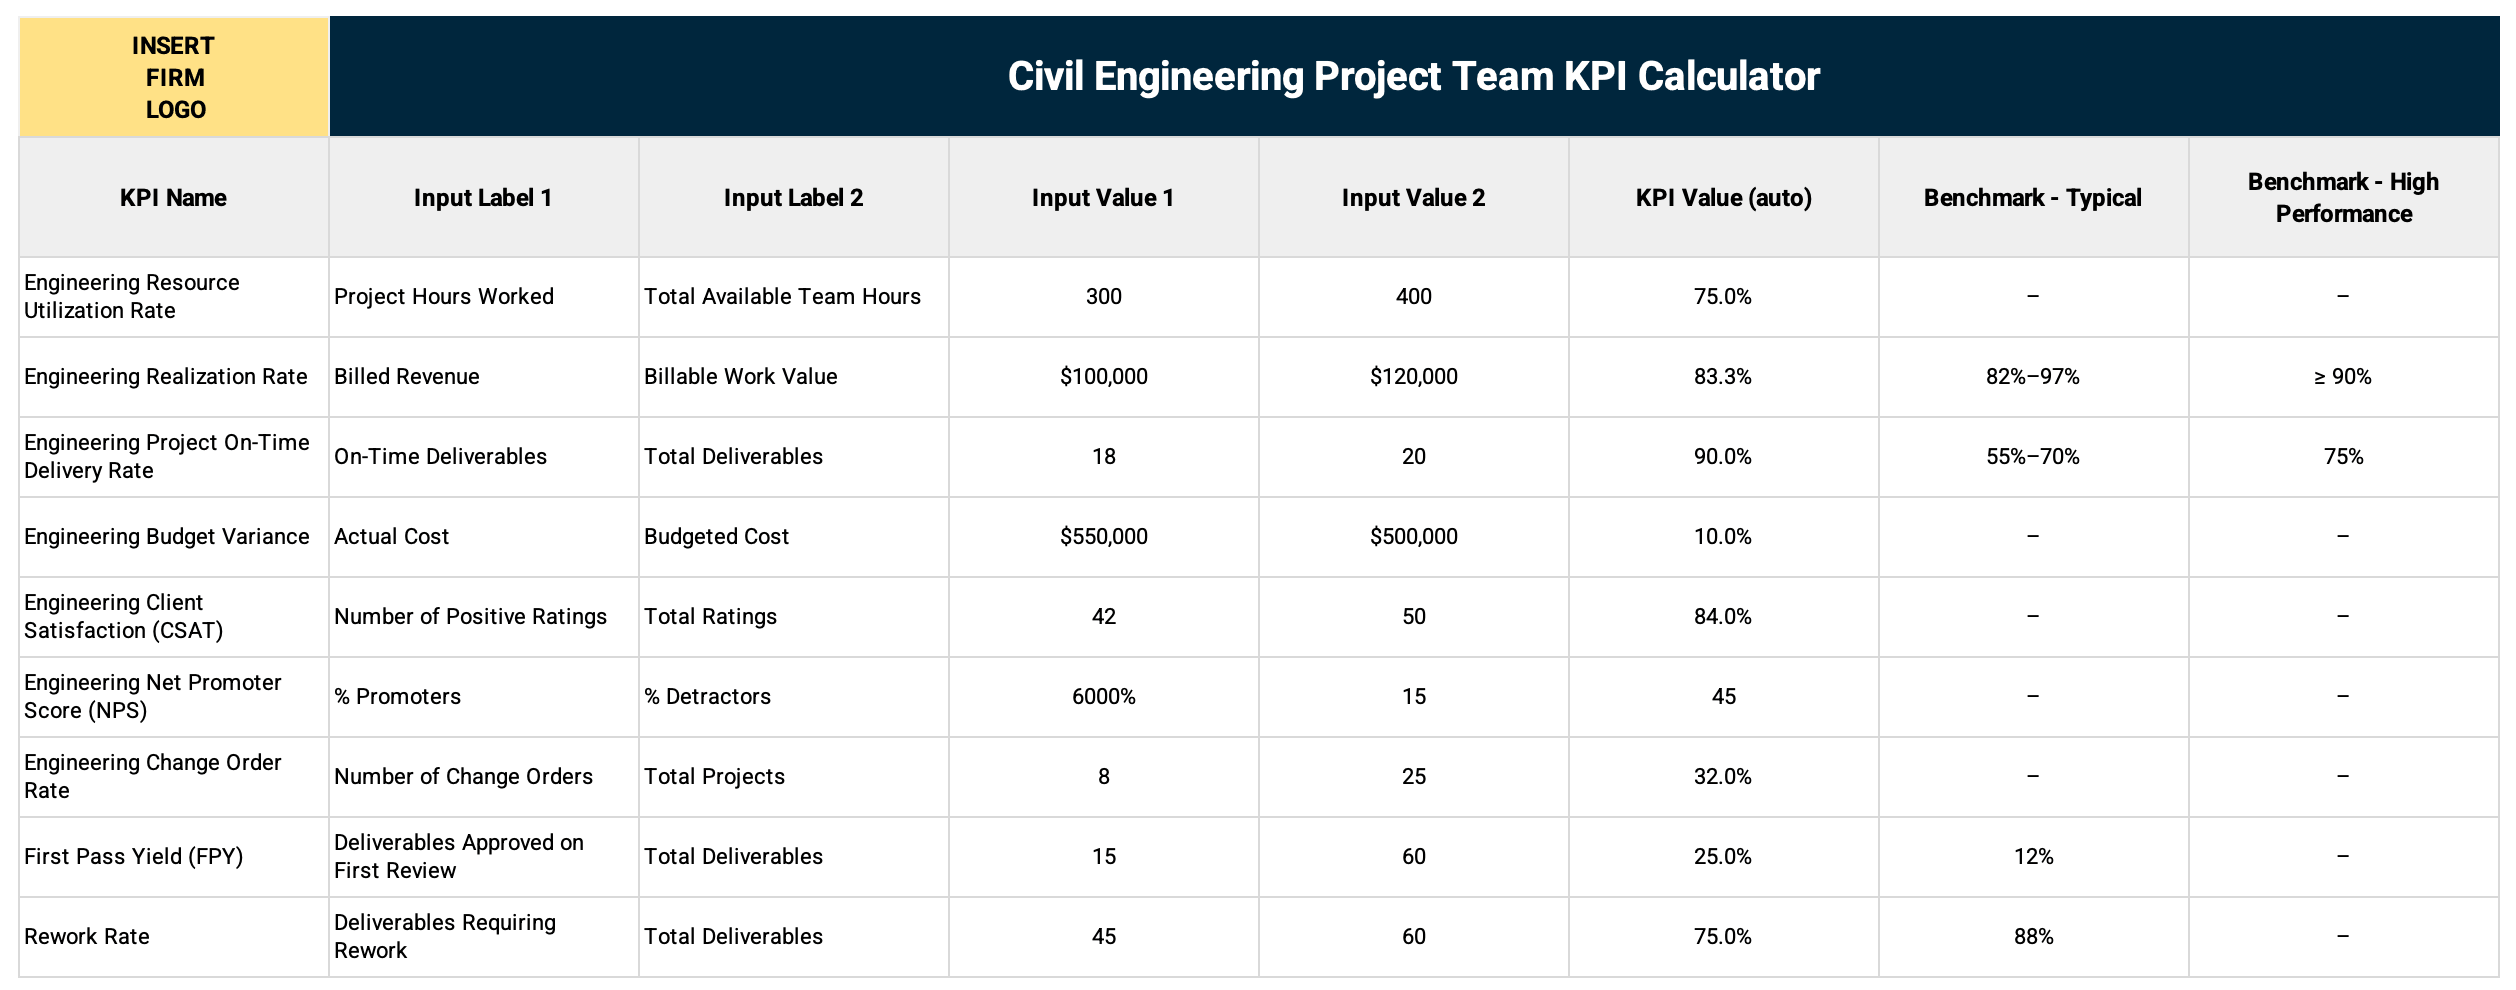
Download the Civil Engineering Project KPI Calculator in Excel or Google Sheets
Civil Engineering Manager KPI Calculator
This sheet highlights managerial performance KPIs, such as planning accuracy, forecasting, team balance, and retention. Enter your values and see your KPI results.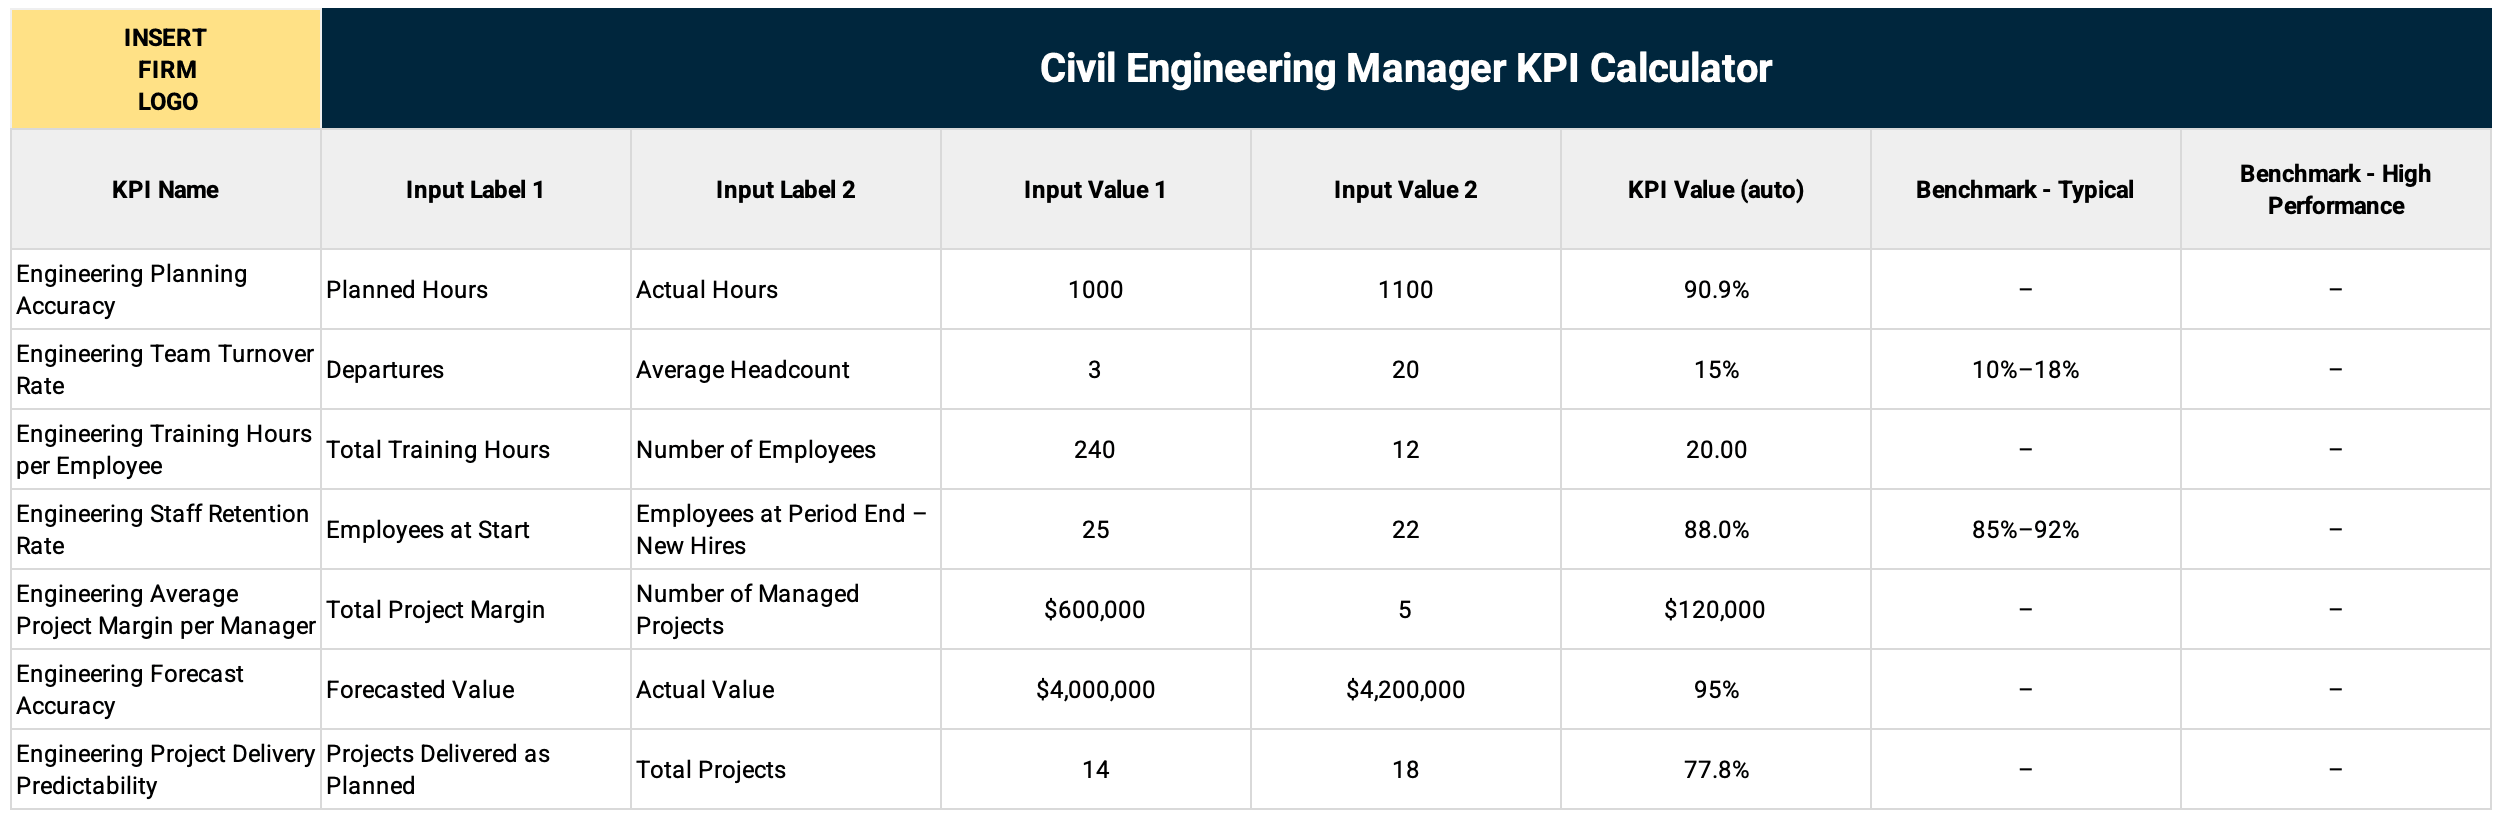
Download the Civil Engineering Manager KPI Calculator in Excel or Google Sheets
How to Build a Civil Engineering KPI Dashboard
To create a civil engineering KPI dashboard, select a set of KPIs that match your firm’s goals. Use a dashboard template such as the one below, input your values, and use standard Excel or Google Sheet functionality to create insightful visualizations, such as charts and graphs.
Here are the details:
- Select the right KPIs: Review the KPIs detailed in this article, and choose the ones that best match your firm’s goals for financial performance, project delivery, or managers. Use our cheat sheets and calculators to help you decide.
- “Start with 3-5 metrics. Not 22,” Heim says. “The number one mistake is launching something too complex. I'd start with utilization, net profit margin, and DSO. Track those consistently for 3 months, then expand.”
- Plan dashboards by role: You’ll want different dashboards for principals, project teams, and managers. Group your KPIs that way. This article groups them the same way and may give you ideas.
- Use a dashboard template: A template saves you time. Try our Excel or Google Sheet dashboard template, detailed in the next section, to visualize your firm’s financial performance. Enter your values and goals or benchmarks, and the template automatically creates a chart or graph to visualize your performance.
- Use Excel or Google Sheets functionality: To make other KPI charts and graphs, use the built-in functions in Excel or Google Sheets. (Our included template does this for you.)
- Move to software when you’re ready: Spreadsheets are helpful, but they have limitations. As your firm matures, you may want a software platform that streamlines your dashboards and reports without all the manual work and time lags.“Real-time data matters,” Heim says. “Dashboards fed by monthly spreadsheet exports are stale within days. Deltek Clarity found 75%+ of firms still use spreadsheets and email for resource management.” To go deeper, see how to track and analyze project performance and KPIs across your firm.
Financial KPI Dashboard Template for Civil Engineering Firms
Use this KPI dashboard template to monitor firm-wide financial performance with charts and graphs. It is designed for principals and finance leaders to track profitability, revenue efficiency, and cash flow, supporting monthly reporting, strategic planning, and early identification of financial risks.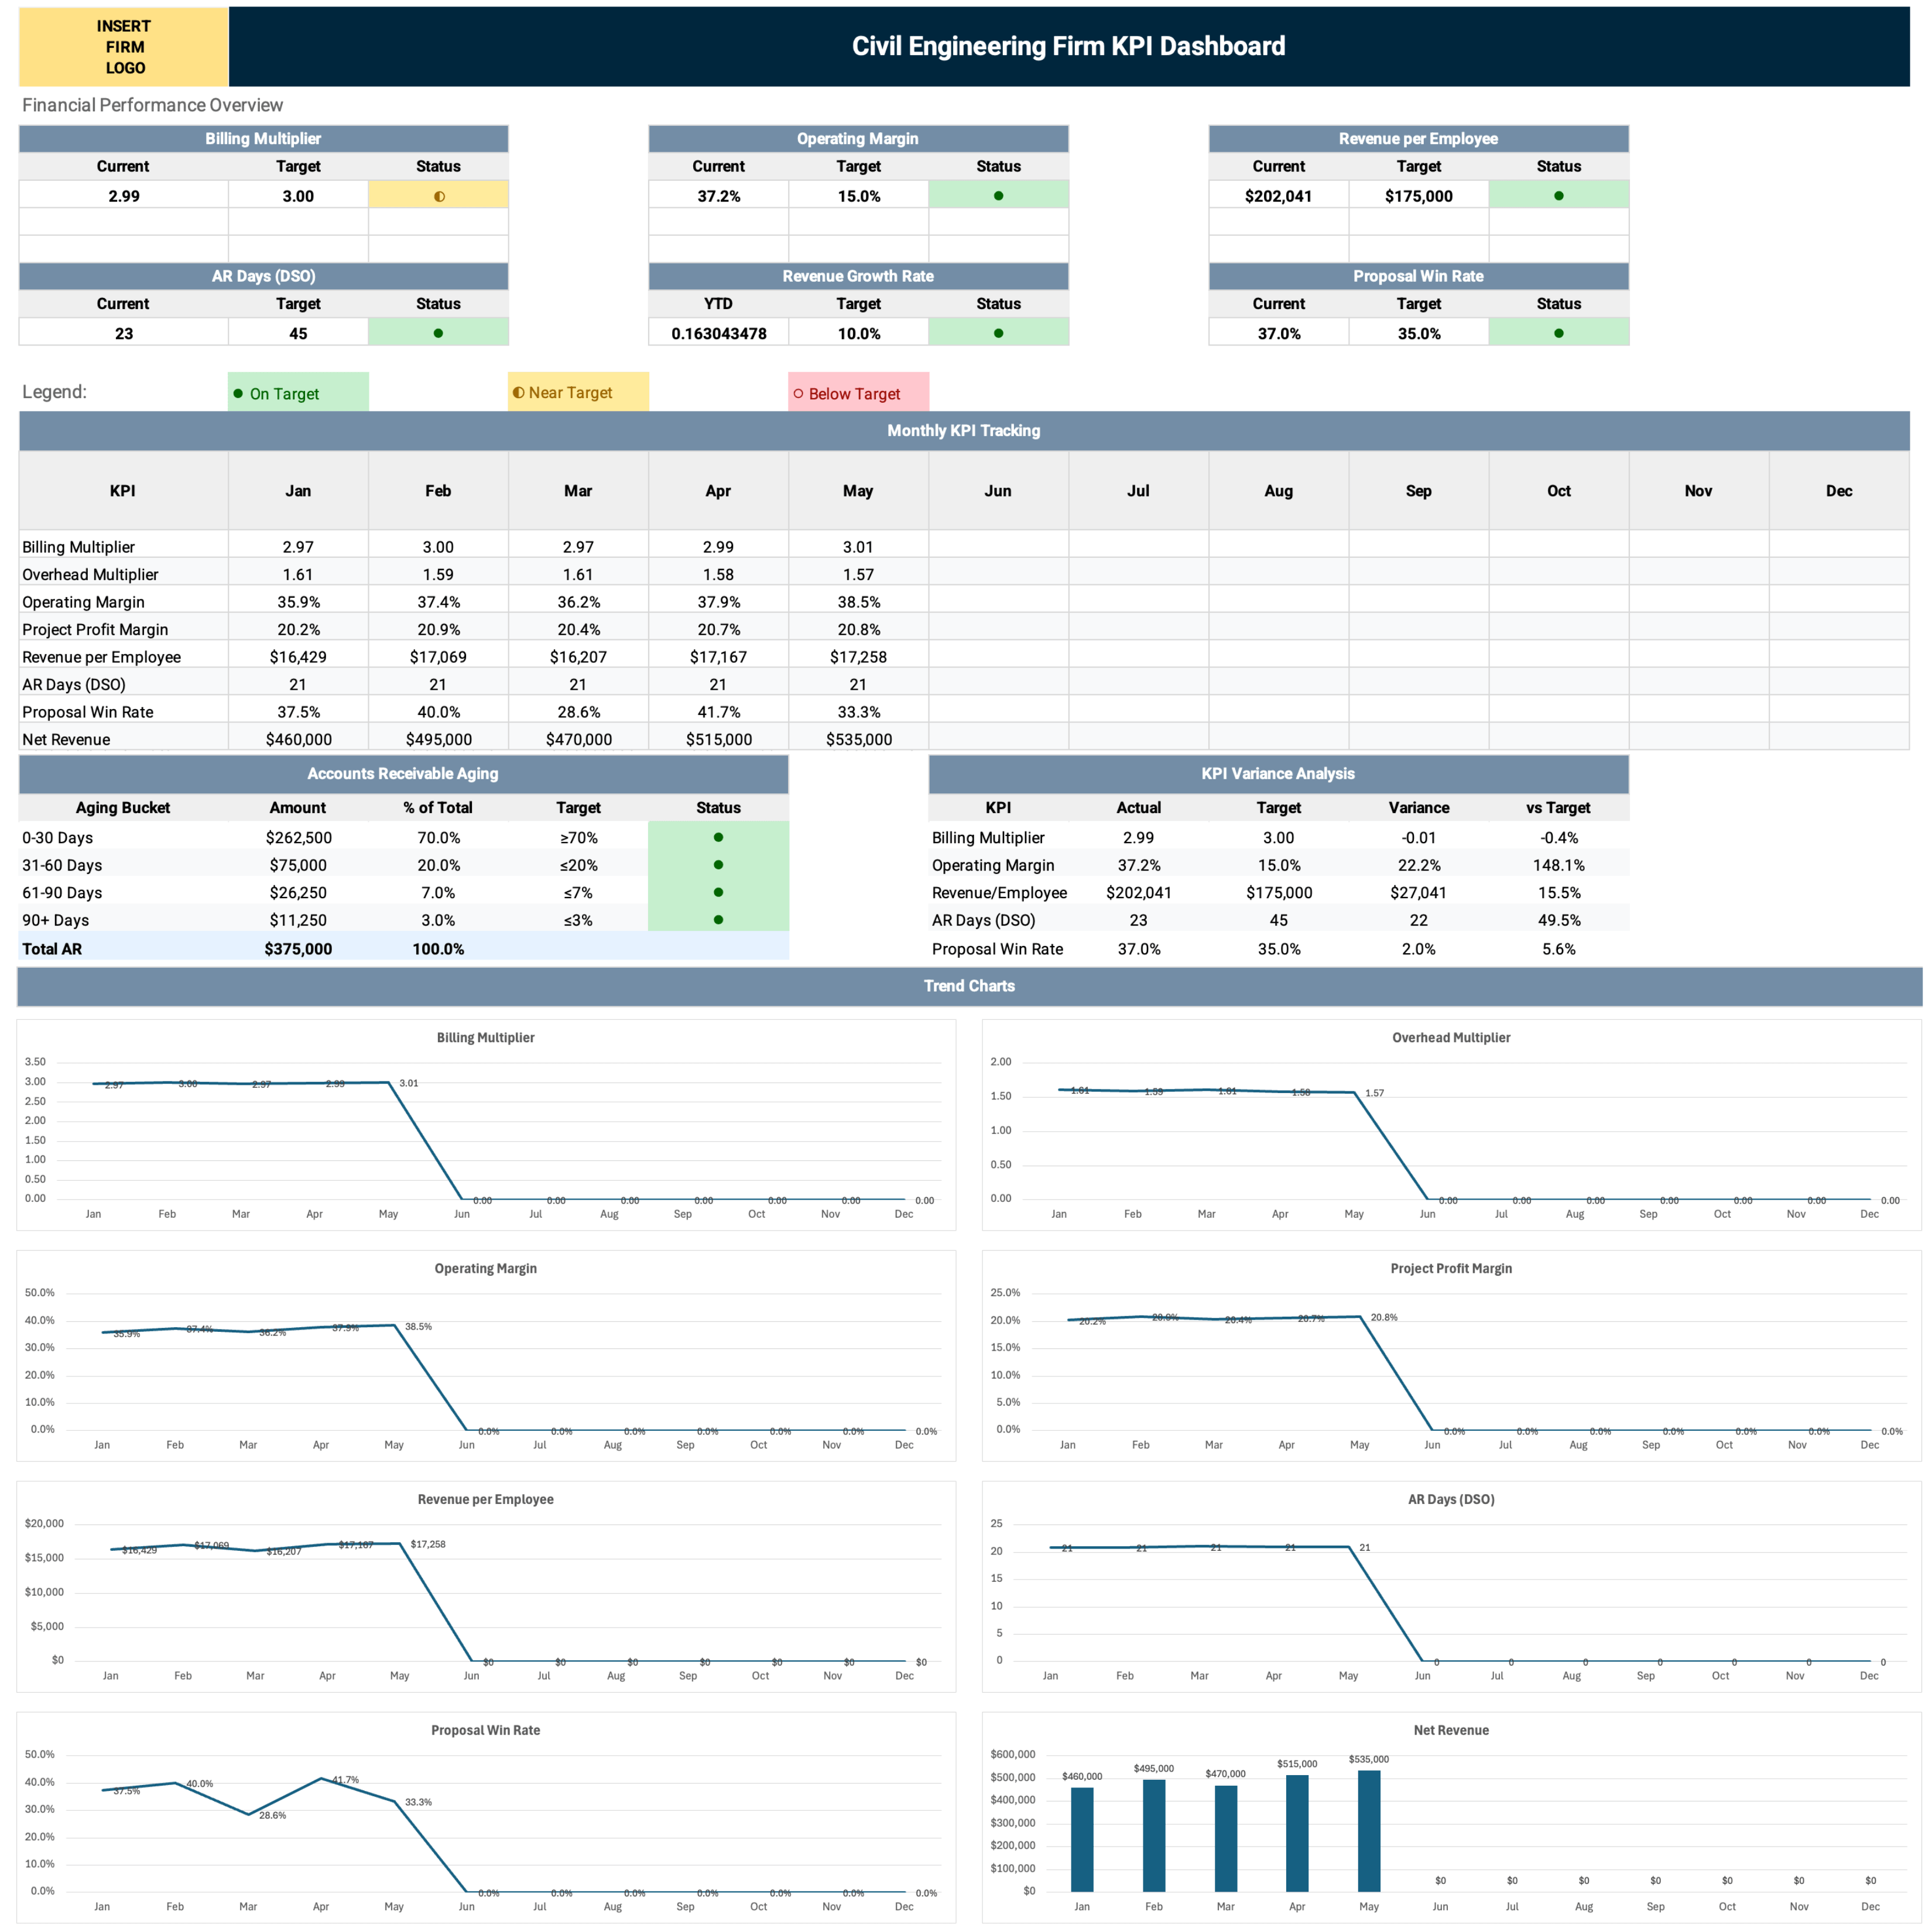
Download the Financial KPI Dashboard Template in Excel or Google Sheets
Best Practices to Make Civil Engineering KPIs Actionable
To make civil engineering KPIs actionable, the most essential best practice is to use them consistently in decision-making. Others include assigning KPI ownership, standardizing usage among teams, visualizing KPIs with dashboards, and using them in post-project reviews.Here’s a closer look at best practices for civil engineering KPIs:
- Tie KPIs to decision-making: Use KPIs in weekly project reviews and leadership meetings. Every metric should inform a specific action or adjustment.
- Assign ownership for each KPI: Make someone accountable for tracking and improving each KPI. Without ownership, metrics tend to drift without impact.
- Track leading and lagging indicators together: Pair financial outcomes (like margin) with operational drivers (like utilization or realization) to identify issues early.
- Standardize definitions and calculations: Ensure all teams calculate KPIs the same way. Inconsistent formulas lead to misleading comparisons and poor decisions.
- Review KPI dashboards at the right cadence: Financial KPIs (monthly), project KPIs (weekly/biweekly), and manager KPIs (monthly/quarterly). Match frequency to how quickly the metric can change.“Weekly for utilization and WIP,” recommends Heim. “Monthly for project profitability and DSO. Quarterly for strategic metrics like multiplier trends and backlog. A dashboard without a scheduled review meeting is decoration.”
- Benchmark internally before externally. Compare performance across teams, project types, and time periods to identify what is working within your firm.
- Close the loop with post-project reviews. Use KPI results to refine estimating, staffing, and processes for future projects. Continuous improvement compounds over time.
Track and Improve Civil Engineering KPIs in BQE CORE
Modern civil engineering firms are moving beyond manual spreadsheets and disconnected systems to track KPIs more accurately and act on them faster. An integrated platform such as BQE CORE connects financial, project, and operational data so firms can monitor performance in one place.
With BQE CORE, time-tracking, invoicing, and accounting data automatically flow into KPI reporting. That makes it easier to measure metrics such as utilization, realization, and project margin without manually rebuilding reports. Teams can then use BQE CORE’s engineering KPI reporting and analytics to spot trends, compare performance, and identify issues before they affect delivery or profitability.
Integrated dashboards also give leaders a clearer view of firm health in real time. Instead of waiting for static monthly reports, they can use operational data to make better decisions about staffing, project performance, and financial planning.
Book your BQE CORE demo today.
Civil Engineering KPI FAQs
How is a civil engineering KPI different from a civil construction KPI?
Civil engineering KPIs measure design delivery, utilization, profitability, and client outcomes. Civil construction KPIs measure field productivity, safety, equipment use, and cost control during project execution.
How do I track KPIs for fixed-fee civil projects vs. hourly ones?
For fixed-fee projects, track realization, project margin, and budget variance to protect the fee. For hourly projects, track utilization, billing multiplier, and revenue per employee to improve billable time and revenue.
What are the most important KPIs for a small civil engineering firm?
Start with the billing multiplier, utilization rate, project profit margin, and AR days. These KPIs give small firms a practical view of cash flow, profitability, and staff productivity without adding too much complexity.
How often should civil engineering KPIs be reviewed?
Review project KPIs weekly or biweekly, financial KPIs monthly, and strategic KPIs quarterly. This cadence helps teams catch delivery issues early while giving leaders enough time to evaluate broader performance trends.
What is a good billing multiplier for a civil engineering firm?
Many firms aim for a billing multiplier between 3.0 and 3.5. High-performing firms may exceed 3.3. If the number drops below 2.5, review pricing, utilization, and overhead.
How do KPIs improve civil engineering project outcomes?
KPIs help teams identify problems before they affect delivery or profit. Metrics such as utilization, realization, and budget variance make it easier to adjust staffing, scope, and schedules before small issues become larger ones.